How the new k6 Cloud app plugin makes it easy to correlate QA data and system metrics in Grafana
Update: the k6 Cloud data source plugin is deprecated. Alternatively, use Grafana Cloud k6, our fully managed performance testing solution now generally available for all Grafana Cloud customers. You can check out the documentation and website for more information about the product.
One of the common challenges when doing performance testing is the difficulty of correlating the metrics of your application with your testing results. Having available QA, infrastructure, and application metrics together allows engineering teams to better understand the behavior of their systems during the testing, helping to detect and prevent potential issues in their applications.
So last year, the team behind the k6 load testing tool started working on a way to view cloud testing results in Grafana. We released the k6 Cloud data source plugin for Grafana in July.
Around the same time, Grafana Labs acquired k6 (hello, Grafana k6!), and over the past several months, the k6 and Grafana teams worked together to enhance the existing offering and build the foundation for more sophisticated integrations between our products.
The new k6 Cloud application plugin for Grafana (currently in beta) now allows you to:
- manage and visualize cloud tests to make your testing accessible in Grafana
- add k6 visualizations to your existing Grafana dashboards
- correlate testing metrics with other system metrics to detect root causes
Installing the k6 Cloud app
Installation using Grafana Cloud is done by selecting the ‘Install plugin’ button on the k6 Cloud app installation page. This will automatically add the plugin to your Grafana instance. For local Grafana instances, follow the grafana-cli instructions.
After the installation, log in to your Grafana instance, and check that the k6 icon appears in the sidebar menu.
You now have to configure the k6 Cloud app data source to use the application. Installed data sources are available from the configuration section in the sidebar menu. Select ‘Data sources’ and then select the k6 Cloud app data source to go to the configuration page.

The k6 Cloud app needs your API token to connect to your k6 Cloud account. Head over to your k6 Cloud API token and copy your API token. Paste the token into the ‘API Token’ field, select ‘Save & test’ to check that your token is valid and that you have a connection to the k6 Cloud.
Navigate cloud tests across various projects
The new k6 Cloud app for Grafana, like the k6 Cloud web app, provides a dashboard including all your tests for a particular project. This view will be familiar for k6 Cloud users. Here, you can select any project and navigate to any test or test runs.

Re-running cloud tests
The k6 Cloud app for Grafana is not only another visualization interface, but it will also provide additional features to interact with your testing. To begin with, the new application offers the possibility to launch an existing cloud test. Select the `Run test` button to start running the test on the k6 Cloud. You’ll be able to visualize the test run immediately on Grafana.

Enhanced visualizations of k6 results
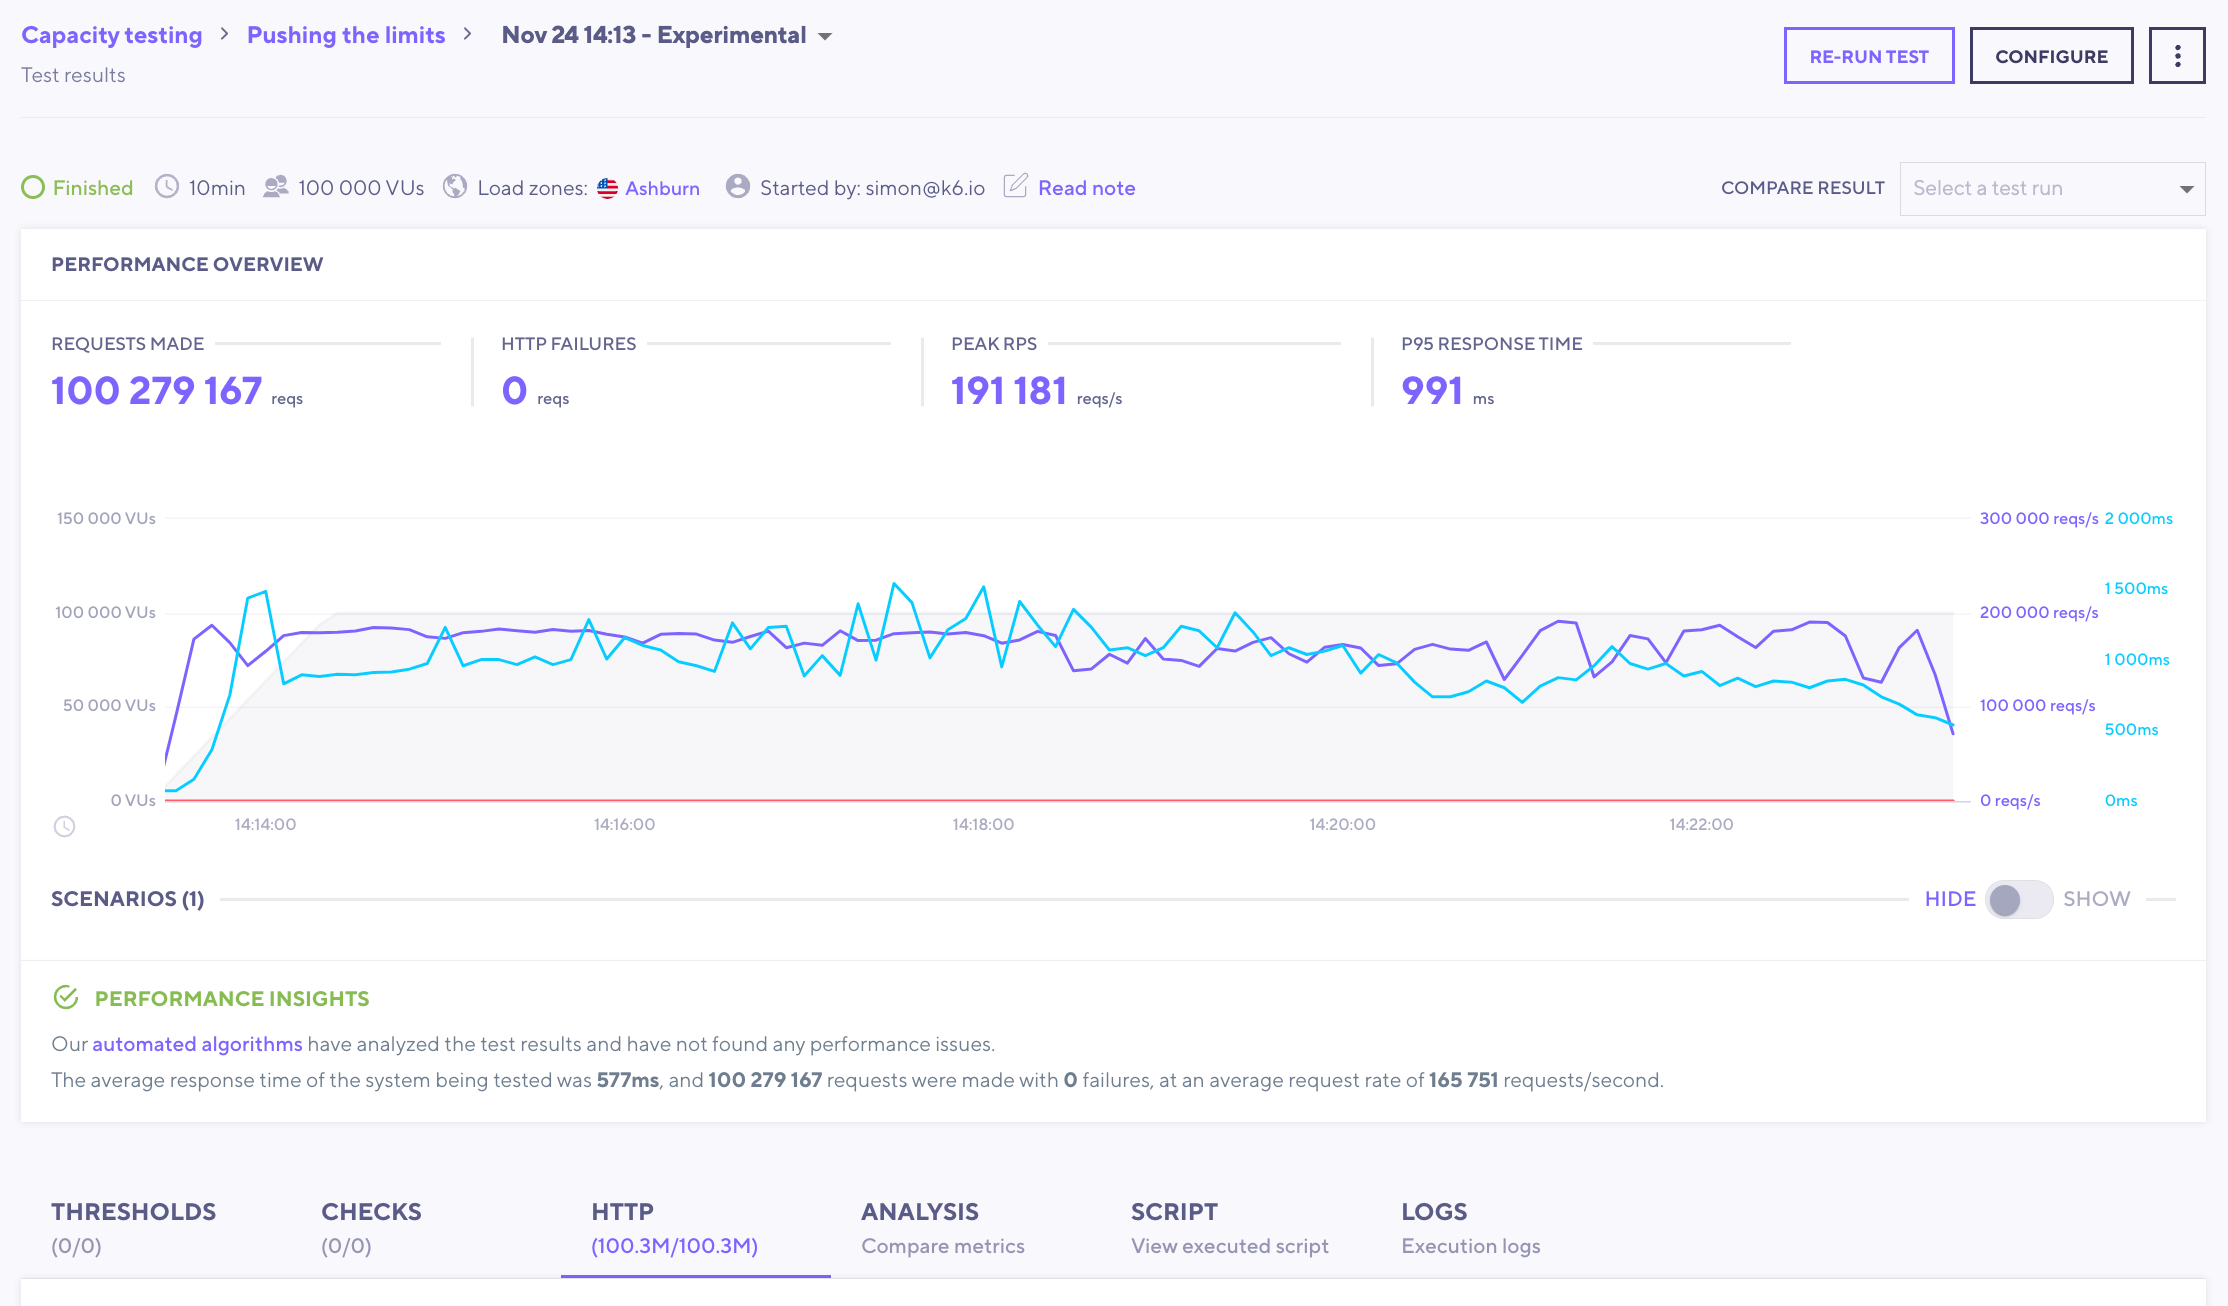
The k6 results view mirrors its counterpart on the k6 Cloud. In this first version, you’ll find an overview of important performance testing metrics and the results of the most relevant k6 reports, such as HTTP requests, thresholds, and checks.

The k6 Cloud app for Grafana is still in beta. The k6 Cloud will currently support more features than the new app. If you want to visualize your test results on the k6 Cloud, you can select `Open in k6 Cloud` to jump quickly to the same page on the k6 Cloud and explore from there.

Correlate testing results with other metrics
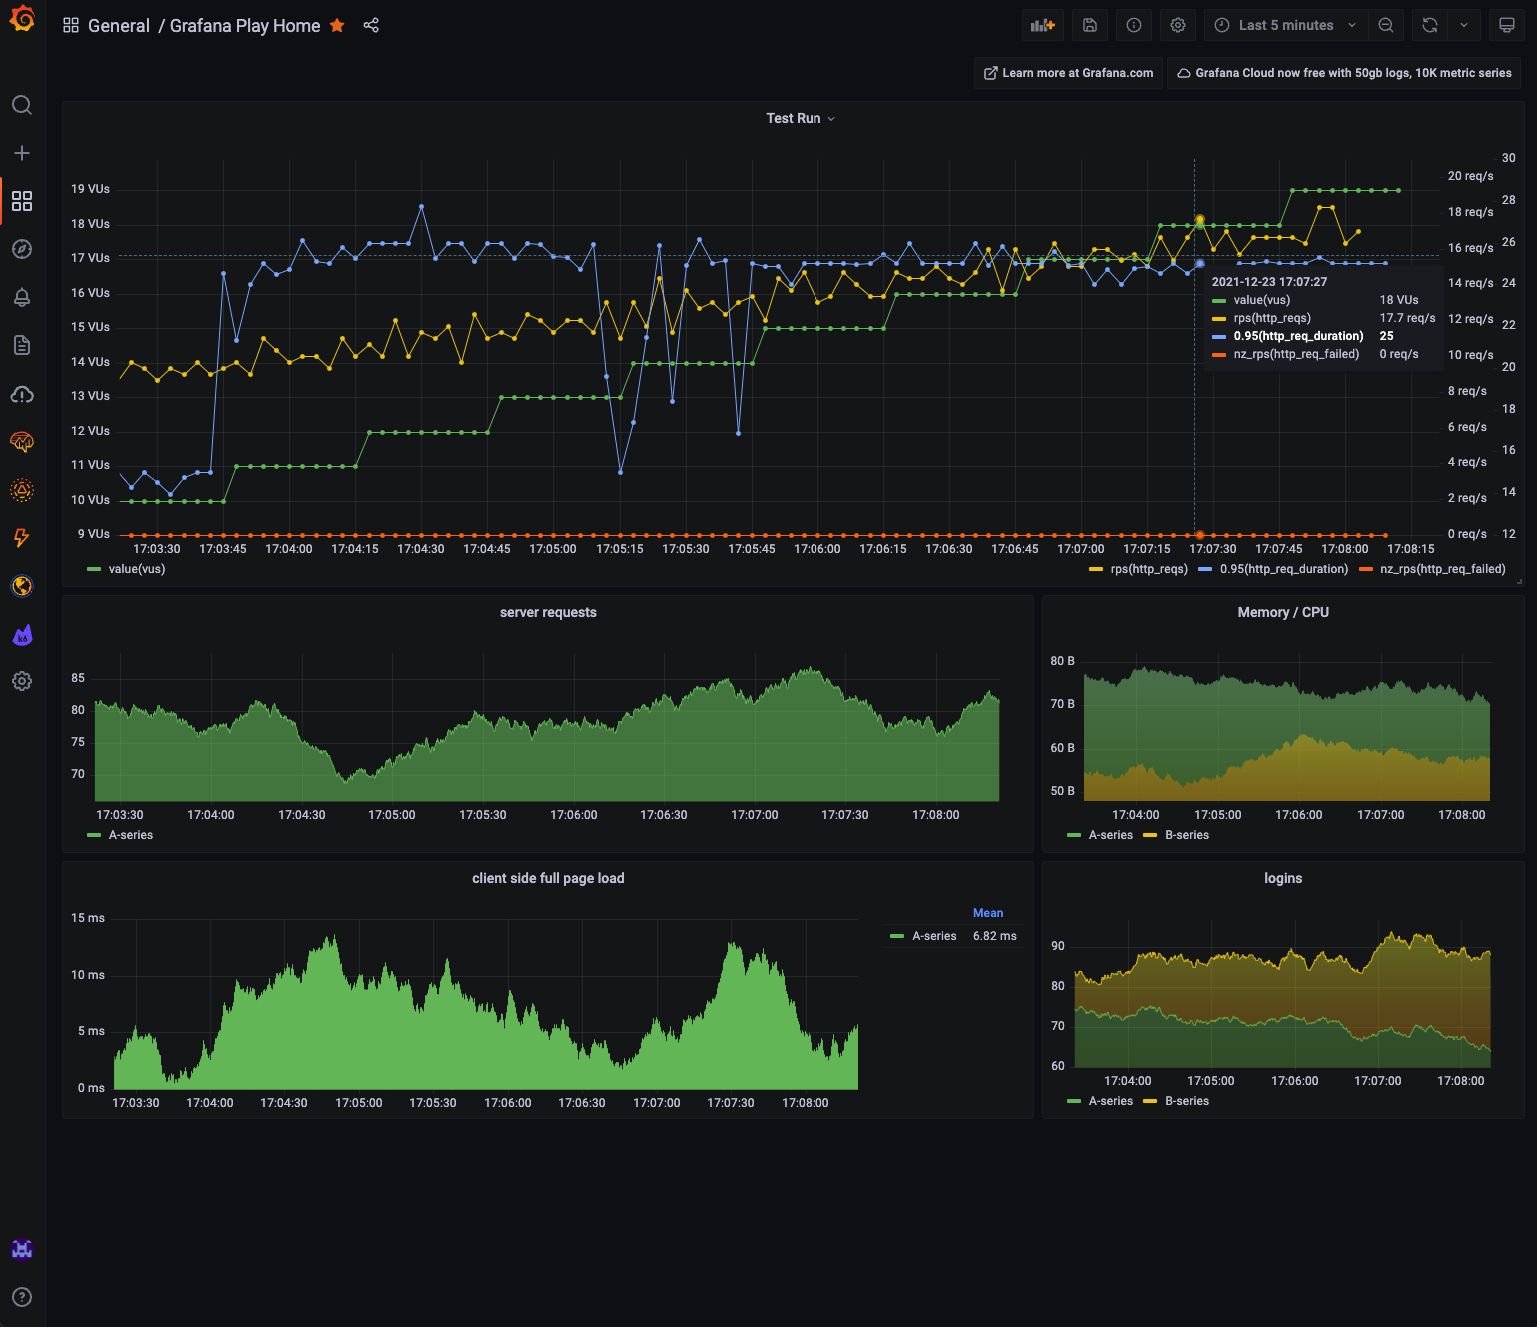
The k6 Cloud app makes it very easy to add relevant metrics from your test result to a Grafana dashboard. Next to each chart on the test results view, you will find a ‘Copy to clipboard’ button which lets you simply paste the exact same time series panel into any one of your dashboards! This feature allows you to visualize k6 metrics together with other metrics of your application or systems and bring QA data to any of your existing dashboards.

What’s next?
There’s much more to come! We’ll improve the new application as we accelerate our plan to integrate k6 with the Grafana stack. Next, we’ll continue enhancing how to visualize the testing results, leveraging Grafana’s capabilities and flexibility to analyze testing results in better and new ways.
We are still at the beginning of our journey. Together with Grafana, k6 can fully support you and your teams in detecting performance issues so that you can be confident about the reliability of your applications.
How would you like to use k6 Cloud in Grafana? Your feedback, as always, is much appreciated and will help us prioritize what is most valuable to you. Chime in on the k6 #grafana Slack channel or contact us and let us know!
Get started today
The new application is available for k6 Cloud users as well as in Grafana Cloud, Grafana Enterprise, and self-hosted instances.
If you are a k6 Cloud user, we recommend you start using and getting familiar with the k6 Cloud app in Grafana as we’ll continue enhancing it. No matter how you instrument your applications and where you store your metrics, Grafana can help visualize all your data.
If you are not using either Grafana Cloud or k6 Cloud, there are free plans for both services available! Sign up now and learn more about k6 Cloud or Grafana Cloud.


