Monitoring remote user workstations with Prometheus, Ansible, and Grafana Cloud
Monitoring is usually associated with servers and applications, but the fintech automation platform Ocrolus recently needed to set up monitoring for a different purpose: to gain meaningful data and insights about nearly 1,000 remote user workstations.
During a presentation at ObservabilityCON 2021, Ocrolus’ tech ops manager Travis Johnson walked through how his company made it happen while reusing as much existing industry tooling and knowledge as possible — specifically Grafana Cloud and Prometheus.

At Ocrolus, production business functions with tight SLAs were tied to the workstation performance. The problem was, “we have nearly 1,000, low-end Linux workstations,” Johnson said. “The older ones are dual-core with a passive heatsink, which we want to start collecting metrics from.”
The machines live in one of two environments: at home with employees, where Ocrolus doesn’t control the network, and in the office with a restricted network. At the time, everyone was working remotely, and there wasn’t a remote management solution in place. Given the number of users, Johnson said he didn’t want to design a one-off solution. He knew that in the future, even a small change in configuration would have required an incredible amount of work.
Johnson knew he wanted a push model, so he went with Ansible for management along with Teleport (an SSH replacement) for general remote access.
Grafana Cloud to the rescue
Johnson said setting up the monitoring system was easy because Grafana Cloud automatically handled the hard parts. For example, the Grafana Agent ensured he didn’t have to worry about resource usage. He didn’t have to think about scaling metrics to handle 1,000 hosts, either. “I think 1,000 is barely a blip on Grafana Cloud’s radar,” he said.
The only real pain point? “Prometheus makes debugging remote-write failures — like a proxy that doesn’t have a URL whitelisted — difficult,” Johnson said. He looked for solutions in Github, but didn’t find them helpful.
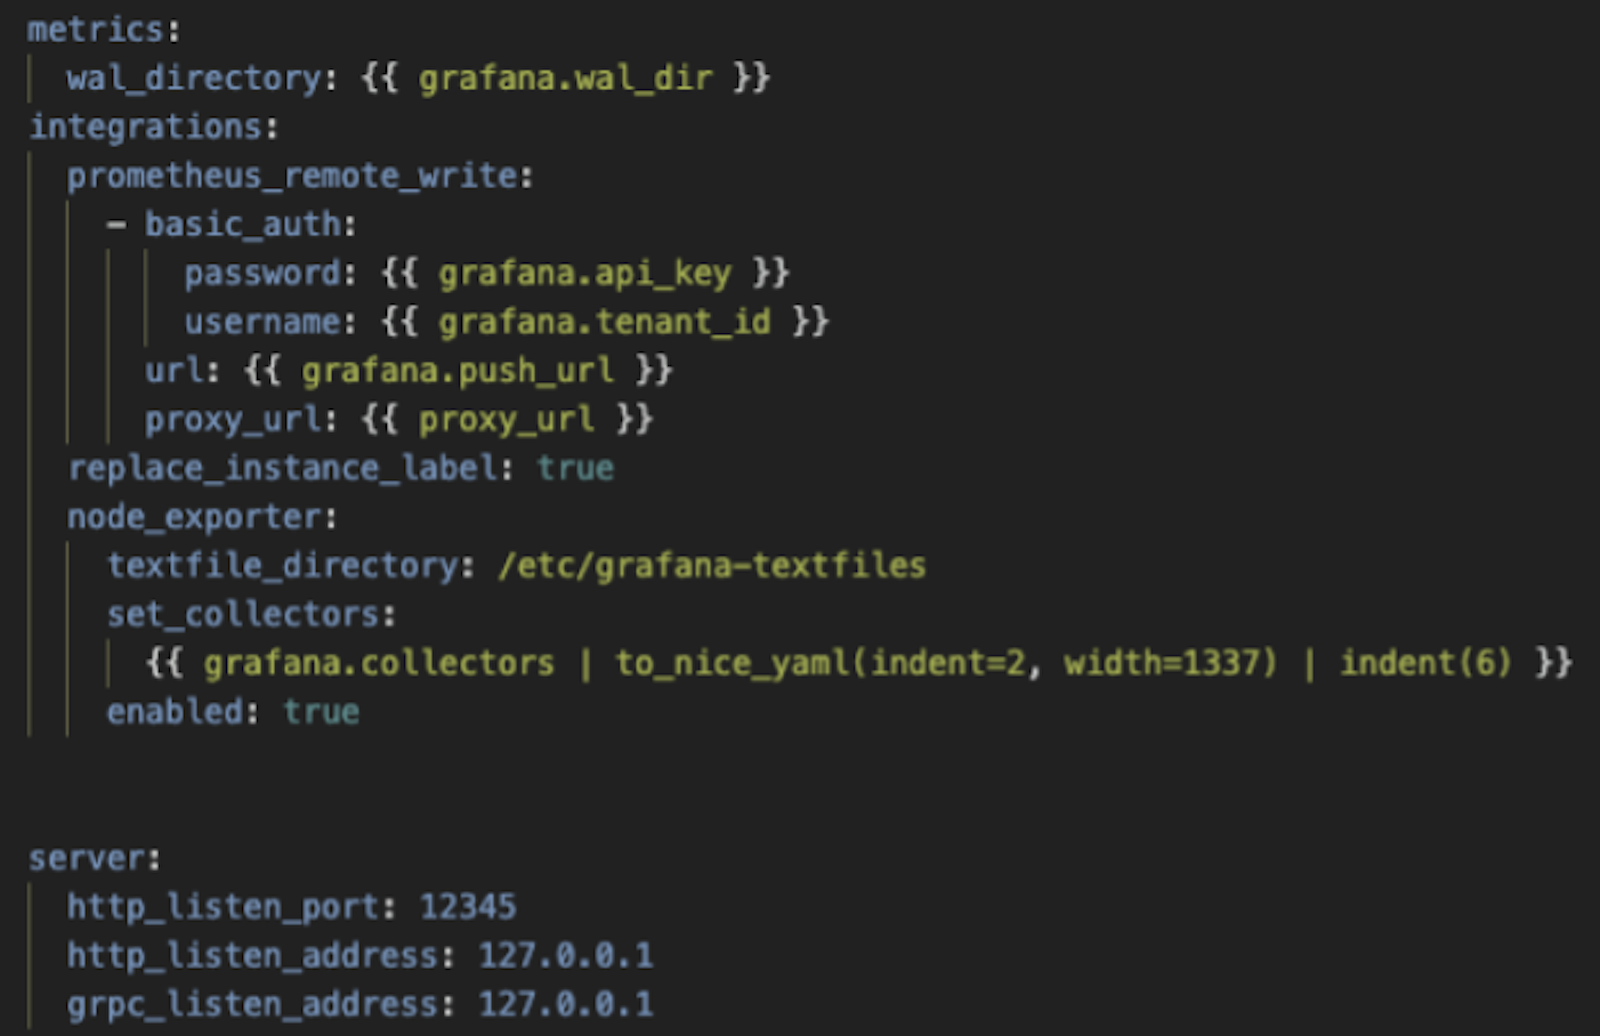
Johnson then moved on to discuss his actual agent configuration and shared this code block from his Ansible repository:

He shared two specific suggestions based on his experience:
- Use
set_collectors(as opposed toenable_collectorsordisable_collectors) because “fighting against — or with — defaults is not a great experience.” - Use the
replace_instance_labelflag. It’s the default value on Grafana agent, but he considers it so valuable that he likes to include it explicitly. “With a naive setup, you might end up with every machine labeling itself as local host,” he said, “and if you use Prometheus to scrape many node experts, you’ll get their IP addresses.” He used Ansible to change the hostname of a machine to match its serial number or the hard drive’s serial number (as seen below).

After that, Johnson had to deal with many unrelated issues, such as bad d-package states, old configurations from previous projects. “The first time that you actually introduce machine management into any infrastructure, you discover all the different ways that everything was drifting,” he explained.
But once the Grafana Agents were on all of the machines, Ocrolus was able to start creating custom metrics using the text file collector.
And all of the work paid off. With the new metrics, he said, the company was able to “make data-driven decisions around moving everything to solid state drive, instead of just because people don’t like it.”
To learn more about monitoring workstations at Ocrolus, check out the full ObservabilityCON session. All our sessions from ObservabilityCON 2021 are now available on demand.
Interested in learning more about Grafana Cloud? Sign up for free now and check out our generous forever-free tier and plans for every use case.


