Video: The new simple, scalable deployment for Grafana Loki and Grafana Enterprise Logs
With the recent release of Loki 2.4 and Grafana Enterprise Logs 1.2, we’re excited to introduce a new deployment architecture.
Previously, if you wanted to scale a Loki installation, your options were: 1) run multiple instances of a single binary (not recommended!), or 2) run Loki as microservices.
The first option was easy, but it led to brittle environments where a heavy query load could take down data ingestion and problems were often difficult to debug. The second option scales well but requires Kubernetes and strong Kubernetes experience.
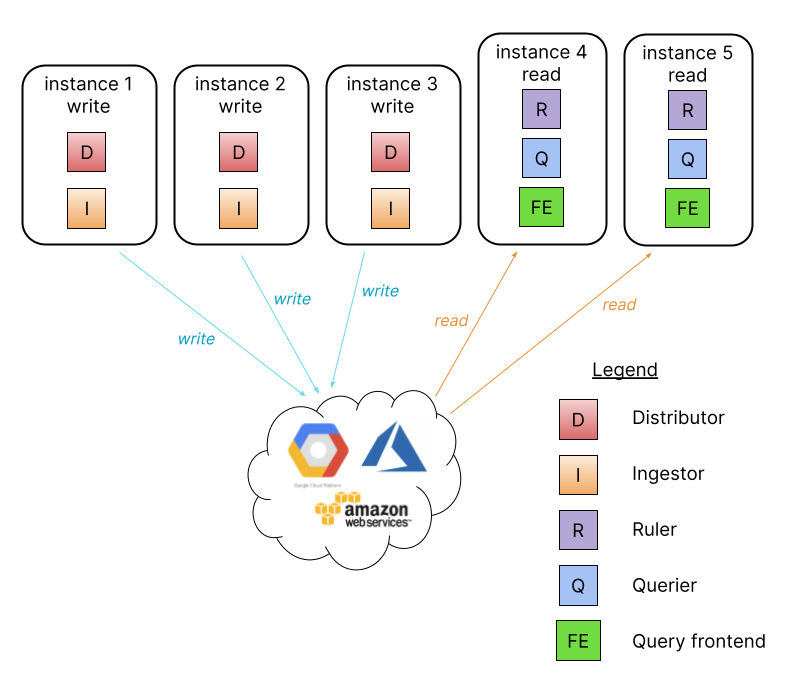
This is why we have introduced a third deployment architecture called the simple, scalable deployment.

The simple, scalable deployment introduces two new targets, `read` and `write`, that provide a simple way to separate the read and write path. The read path handles the servicing of queries, and it can be scaled independently from the write path, which handles the ingestion of data. To help you get started with this new architecture, I’ve put together a 20-minute walkthrough on how to get up and running on VMs. (No Kubernetes required!)
In the above video, I turn two empty VMs into a write and read instance (respectively) of GEL that can be scaled independently. To get there, I went through a few iterations: I first deployed GEL in single binary mode (read and write path together on a single instance); then migrated to a single read and single write node still using local file storage; and finally migrated to a single read and single write node using a shared object storage backend.
Just to be clear, using local file system storage is not supported for any deployment with more than one write and/or read node and was used in this example to get up and running quickly.
Also, to clarify the statement at the end of the video about it being a “production-ready architecture,” I am referring to the segregation of the write and read path. The deployment we finished with was still using MiniIO as the backend and had authentication disabled —neither of which are recommended for a production environment. However, that same configuration, assuming authentication was enabled and MinIO was replaced with a production-ready object storage backend like S3 or GCS, is ready for production, and it does allow you to scale the read and write nodes independently as your load demands.
For reference, here is a copy of that final configuration from the video.
auth_enabled: false

server:
 http_listen_port: 3100

memberlist:
 join_members:
  - loki:7946

common:
 replication_factor: 1
 path_prefix: /var/lib/enterprise-logs
 ring:
  kvstore:
   store: memberlist
 s3:
  endpoint: minio:9000
  insecure: true
  bucketnames: loki-data
  access_key_id: loki
  secret_access_key: supersecret
  s3forcepathstyle: true

ingester:
 chunk_idle_period: 1h
 max_chunk_age: 1h
 chunk_retain_period: 30s

schema_config:
 configs:
  - from: 2020-10-24
	store: boltdb-shipper
	object_store: filesystem
	schema: v11
	index:
 	prefix: index_
 	period: 24h

ruler:
 alertmanager_url: http://localhost:9093
Here are the links to download the latest releases of GEL and Loki.
I hope you enjoyed this video tutorial, and it helps you get up and running with Loki and GEL faster.
As always, we very much appreciate feedback from the community, so please let us know about your experiences with the simple, scalable deployment architecture of GEL and Loki. You can find us on the Grafana Labs community forum or on the #Loki channel on our community Slack.
You can also read more about Loki, or if you’re interested in trying out Grafana Enterprise Logs, please contact us!


