Learn about reducing MTTR, scaling metrics, and the real cost of observability in our new webinars
After three days of exciting feature announcements and jam-packed sessions at ObservabilityCON 2021, are you still hungry for more observability talk? Then register now for one of our upcoming webinars led by Grafana Labs’ technical experts.
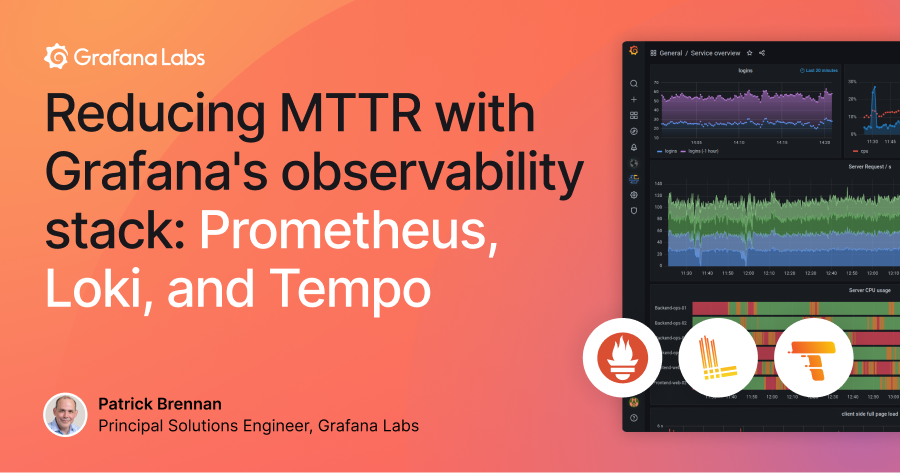
Reducing MTTR with Grafana’s observability stack: Prometheus, Loki, and Tempo
Tuesday, November 16 @ 9:30 PST, 12:30 EST, 17:30 UTC
Grafana Labs Principal Solutions Engineer Patrick Brennan will demonstrate how working with Grafana’s opinionated stack — Prometheus for metrics, Loki for logs, and Tempo for traces — can help you not only reduce MTTR. You’ll also better understand the state of your environment and how to address underlying issues that could be contributing to ongoing issues.
The webinar will also show you how, within Grafana, you can see an issue first by using metrics and then logs without manually doing anything. And then you’ll learn how you can seamlessly move on to traces to further pinpoint the problem.

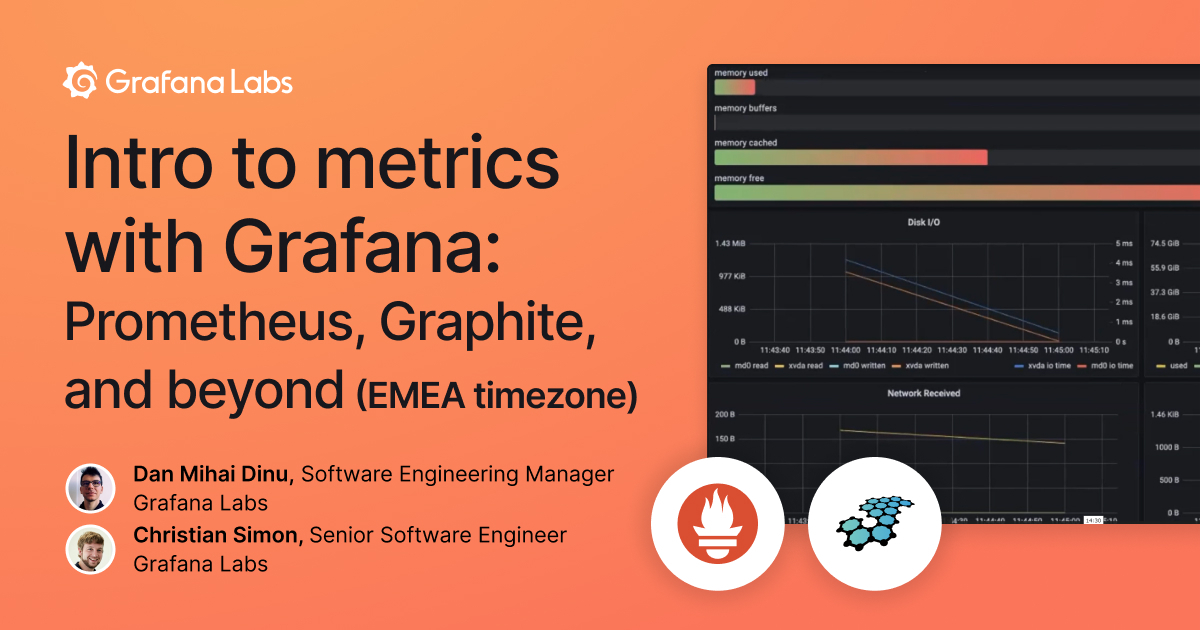
Intro to metrics with Grafana: Prometheus, Graphite, and beyond (EMEA)
Wednesday, November 17 @ 10:00 CET, 09:00 UTC
In this webinar, Grafana Labs Software Engineering Manager Dan Mihai Dinu and Grafana Labs Senior Software Engineer Christian Simon will address some of the challenges users encounter when scaling their metrics systems — and how Grafana Labs helps organizations resolve these issues.
With tools such as Grafana Cloud Metrics and Grafana Enterprise Metrics, you can easily store, query, and manage your metrics. With Grafana Cloud, you can get started using your existing metrics. And with this online session, you’ll see the vital role that metrics plays in any observability strategy.

The real TCO (total cost of ownership) of your observability
Tuesday, December 14 @ 9:30 PST, 12:30 EST, 17:30 UTC
Nowadays, companies can choose from a wide variety of open source and proprietary technologies which signals a strong desire for engineers to create more custom observability solutions. These technologies bring positive business outcomes, such as reducing the impact of downtime, improving customer experience, and boosting operational excellence. However, observability practitioners often lack the tools required to effectively shift the conversation from the technical aspects of a project to the value of a solution within their organizations.
Grafana Labs Principal Solutions Engineer Abdelkrim Hadjidj will explain how value engineering (VE) can demystify the real cost — and savings — of an observability stack. You will learn how to build and customize a total cost of ownership (TCO) tool to produce holistic, quantifiable, and actionable metrics for business stakeholders, whether you are justifying a budget for a new observability project or looking for data to ask for a promotion.

Check out all of our webinars and on-demand conference videos for in-depth demos, deep dive discussions, helpful Q&As, and more!


