Introducing new integrations to make it easier to monitor Vault with Grafana
HashiCorp Vault is an increasingly popular multi-cloud security tool that allows users to authenticate and access different clouds, systems, and endpoints, and centrally store, access, and deploy secrets. At Grafana Labs, we’re always looking for ways to make it easy for our community to get started monitoring important parts of their systems. So we’re happy to share some new integrations that will help our users get the most out of Grafana + Vault.
Metrics and logs streaming from Vault Cloud to Grafana Cloud
With this new integration, it’s easier than ever to get your Vault Cloud metrics and logs into Grafana Cloud, our fully managed observability platform, so you can monitor Vault Cloud natively.
Previously, the process was largely manual, requiring users to set up metrics and log collection and forward the data to Grafana Cloud on their own. Host metrics were not available, and you would need to determine which of the multitude of Vault metrics were most useful.
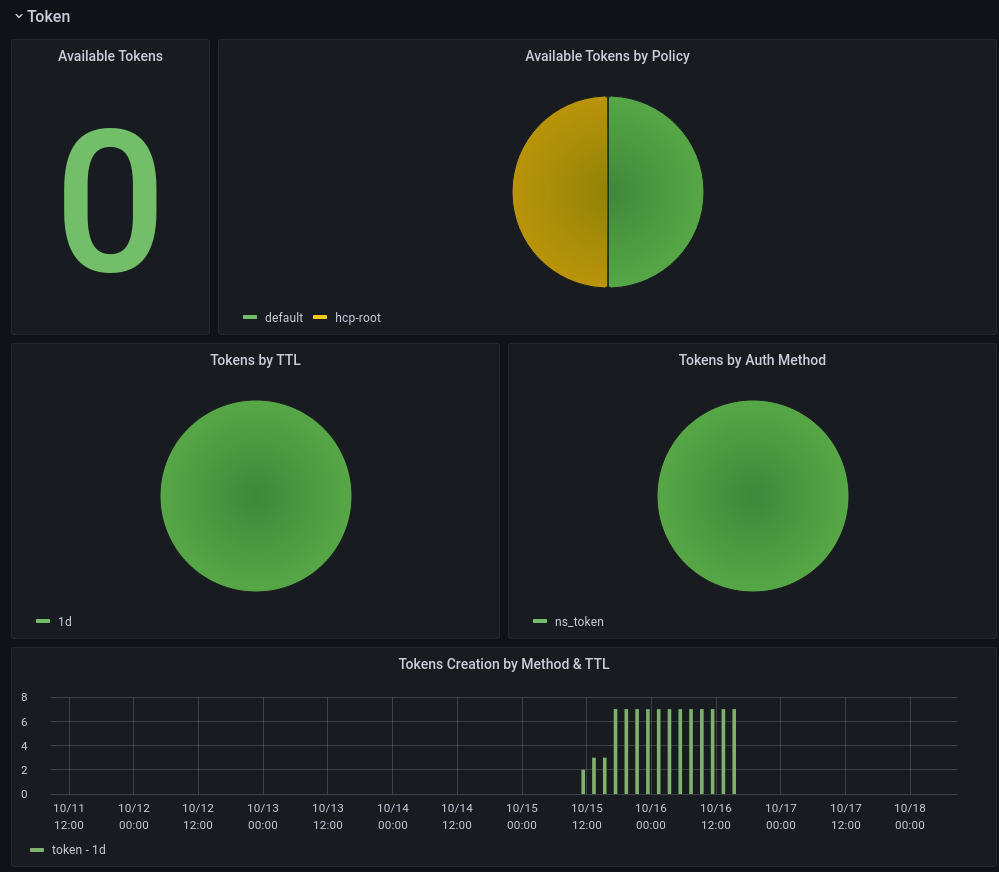
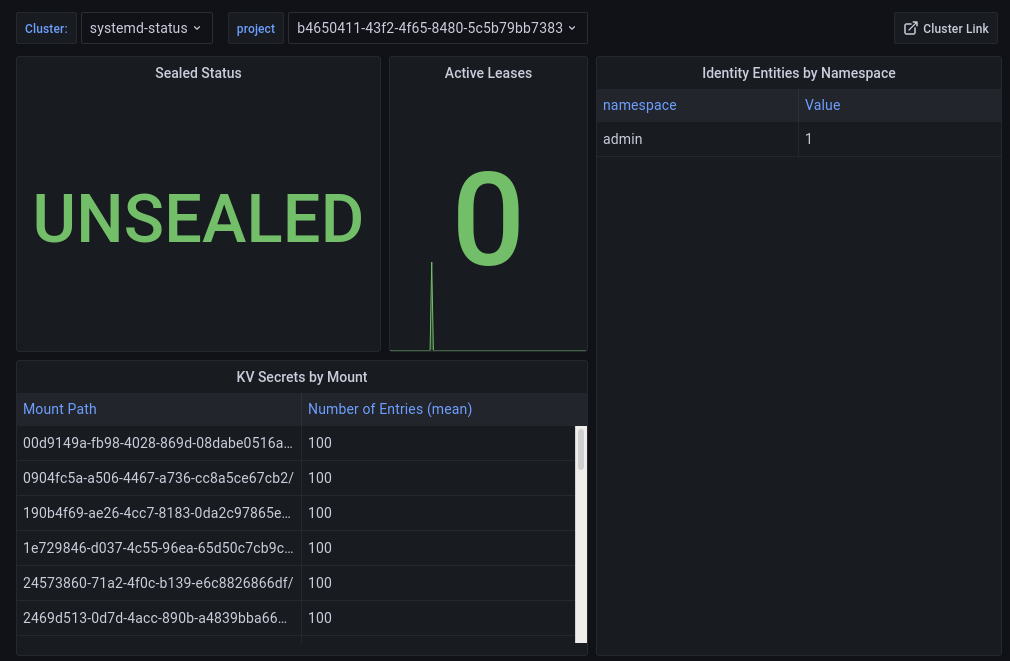
Now, there are turnkey metrics and audit log streaming to Grafana Cloud. The integration includes a sample metrics dashboard, with a focus on best practices and user-actionable metrics.
How to get started
In order to stream data from Vault Cloud to Grafana Cloud, you will first need to create a Grafana Cloud account. Then you can copy and paste the necessary information into your Vault Cloud streaming configurations.
From Grafana Cloud
Sign up for Grafana Cloud if you don’t already have an account.
Navigate to the Cloud Portal by clicking on My Account or Login in the upper right-hand menu of the main website.
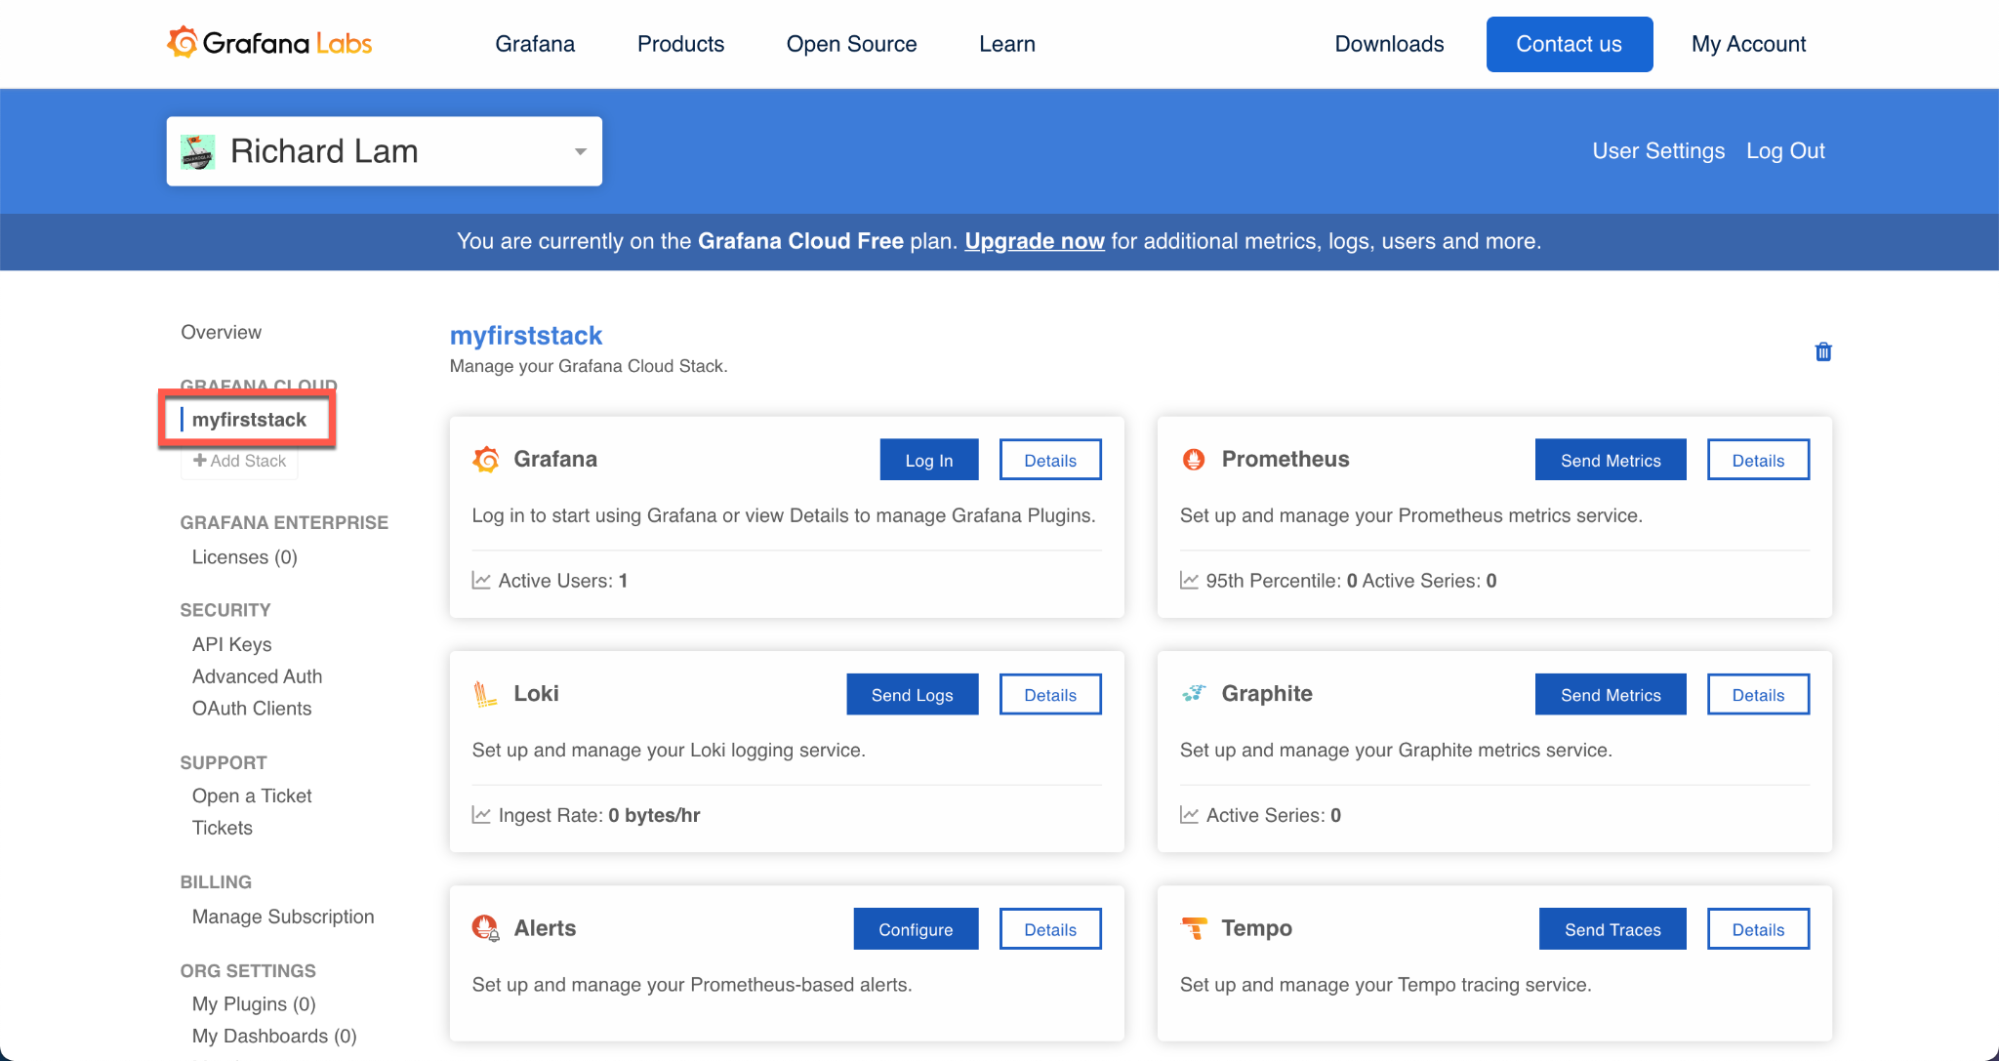
In the Cloud Portal, select your stack name on the left-hand menu, under the Grafana Cloud section.
![]()
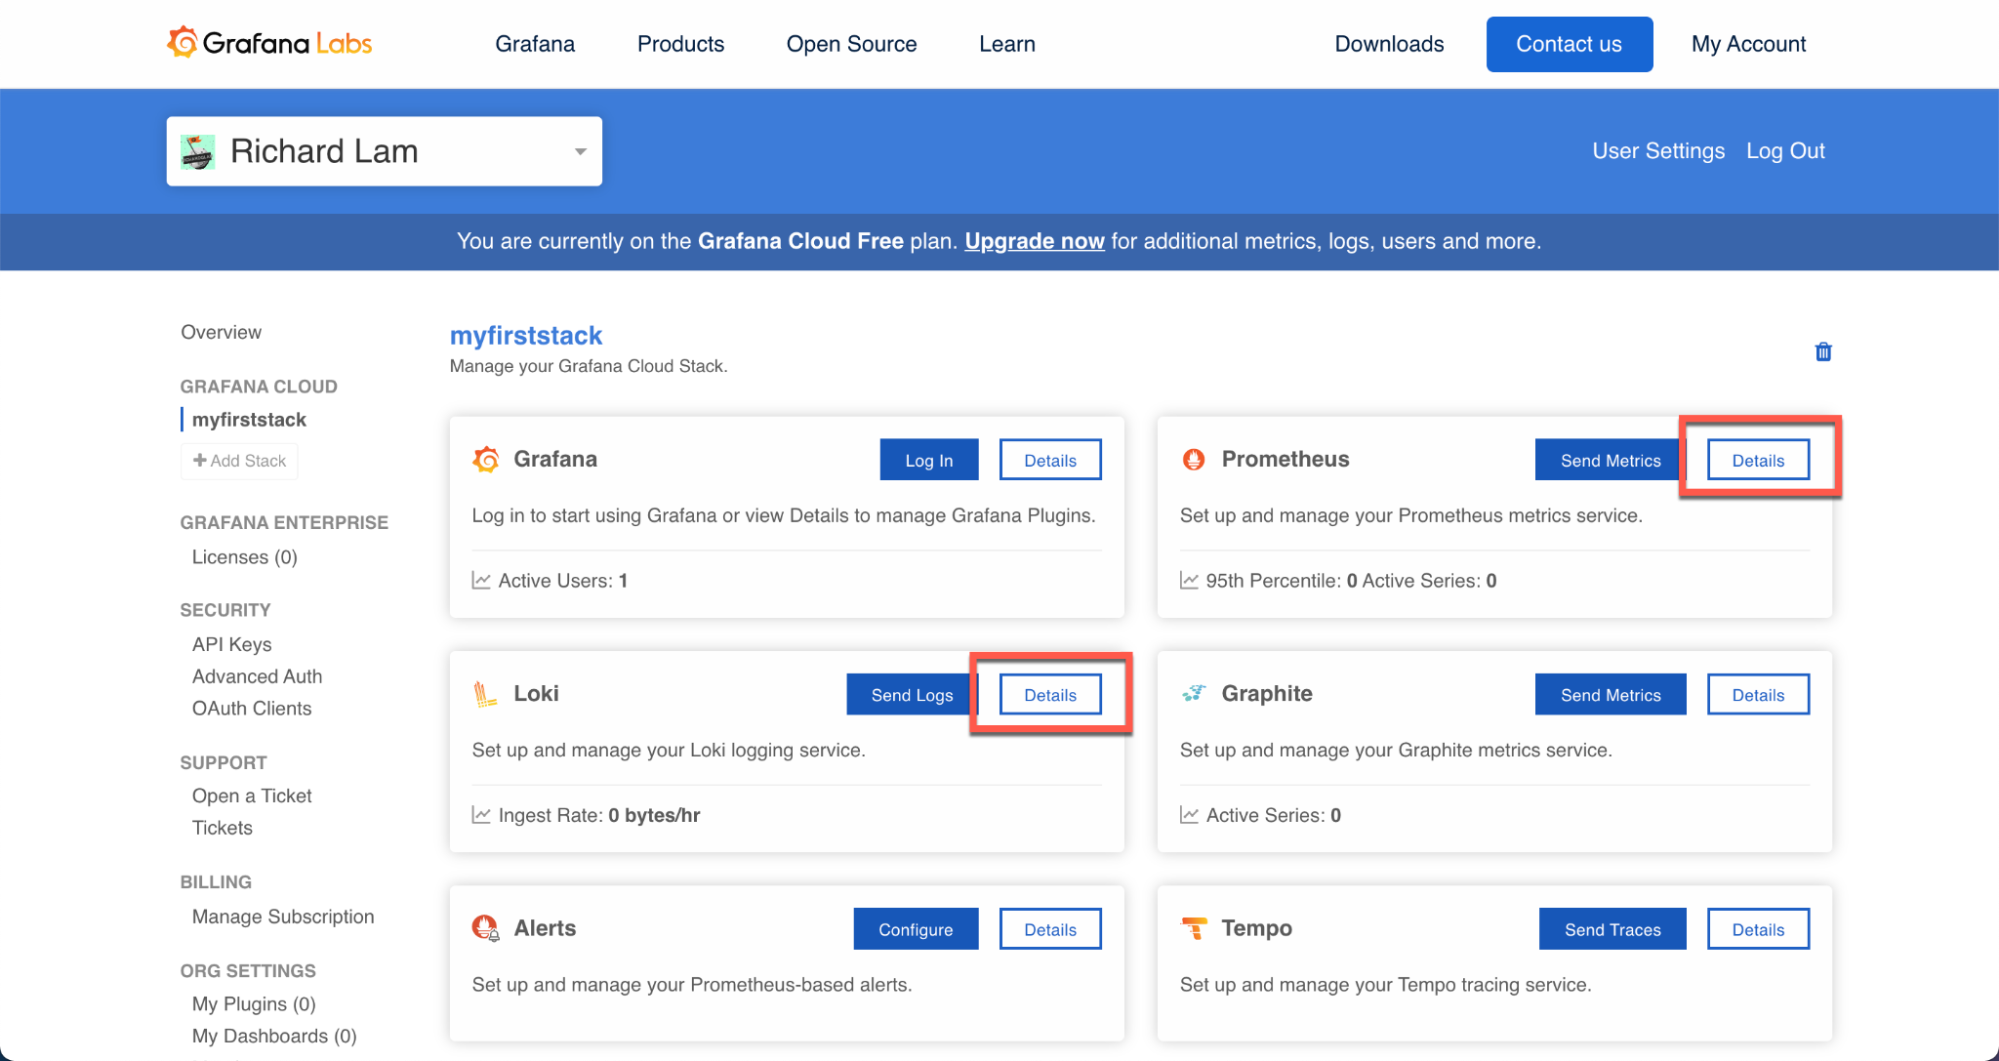
If you’re configuring metrics streaming, then click on the Details button on the Prometheus card. If you’re configuring logs streaming, then click on the Details button under the Loki card instead.
![]()
For metrics, copy the following information from the Prometheus details page into your Vault Cloud streaming configurations:
- Copy the Remote Write Endpoint URL for the Vault Cloud endpoint.
- Copy the Username / Instance ID for the Vault Cloud user.
- Generate and copy the Password / API Key for the Vault Cloud password.
For logs, copy the following information from the Loki details page into your Vault Cloud streaming configurations:
- Copy the URL for the Vault Cloud endpoint.
- Copy the User for the Vault Cloud user.
- Generate and copy the Password for the Vault Cloud password.
From Vault Cloud for Metrics
From the HCP Portal, go to Vault cluster Overview, select the Metrics view.
![]()
If you haven’t yet configured metrics streaming before, click Enable streaming. Otherwise skip to Step 3.
From the Stream Vault metrics view, select Grafana Cloud as the provider.
Under Grafana Cloud Configuration, enter your Endpoint url, and Grafana Cloud username and password.
![]()
Click Save.
HashiCorp has created a sample HCP Vault Grafana dashboard template for metrics visualizations. If you prefer to use the sample dashboard template, follow the Grafana Labs instructions for adding a Grafana dashboard template to your Grafana Cloud environment.
From Vault Cloud for Logs
From the HCP Vault cluster Overview, select the Audit Logs view.
![]()
Click Enable streaming.
From the Enable audit logs streaming view, select Grafana Cloud as the provider.
Under Grafana Cloud Configuration, enter your Endpoint url, and Grafana Cloud username and password.
![]()
Click Save.
Refer to the Grafana Cloud Logs documentation for instructions on log querying and visualizations.
Grafana Cloud integration for Vault OSS
For those using self-managed, open source Vault, the Grafana Labs team has introduced a new Grafana Cloud integration that bundles the Grafana Agent, tailored Grafana dashboards, and sane alerting defaults so you can get a preconfigured Prometheus- and Grafana-based observability stack up and running in minutes.
The Vault integration on Grafana Cloud is located here. It only requires you to update your Prometheus configuration, which is documented here. Vault has a lot of moving parts, so we wanted to offer a quick way for you to get from installation to metrics and dashboards as seamlessly as possible.
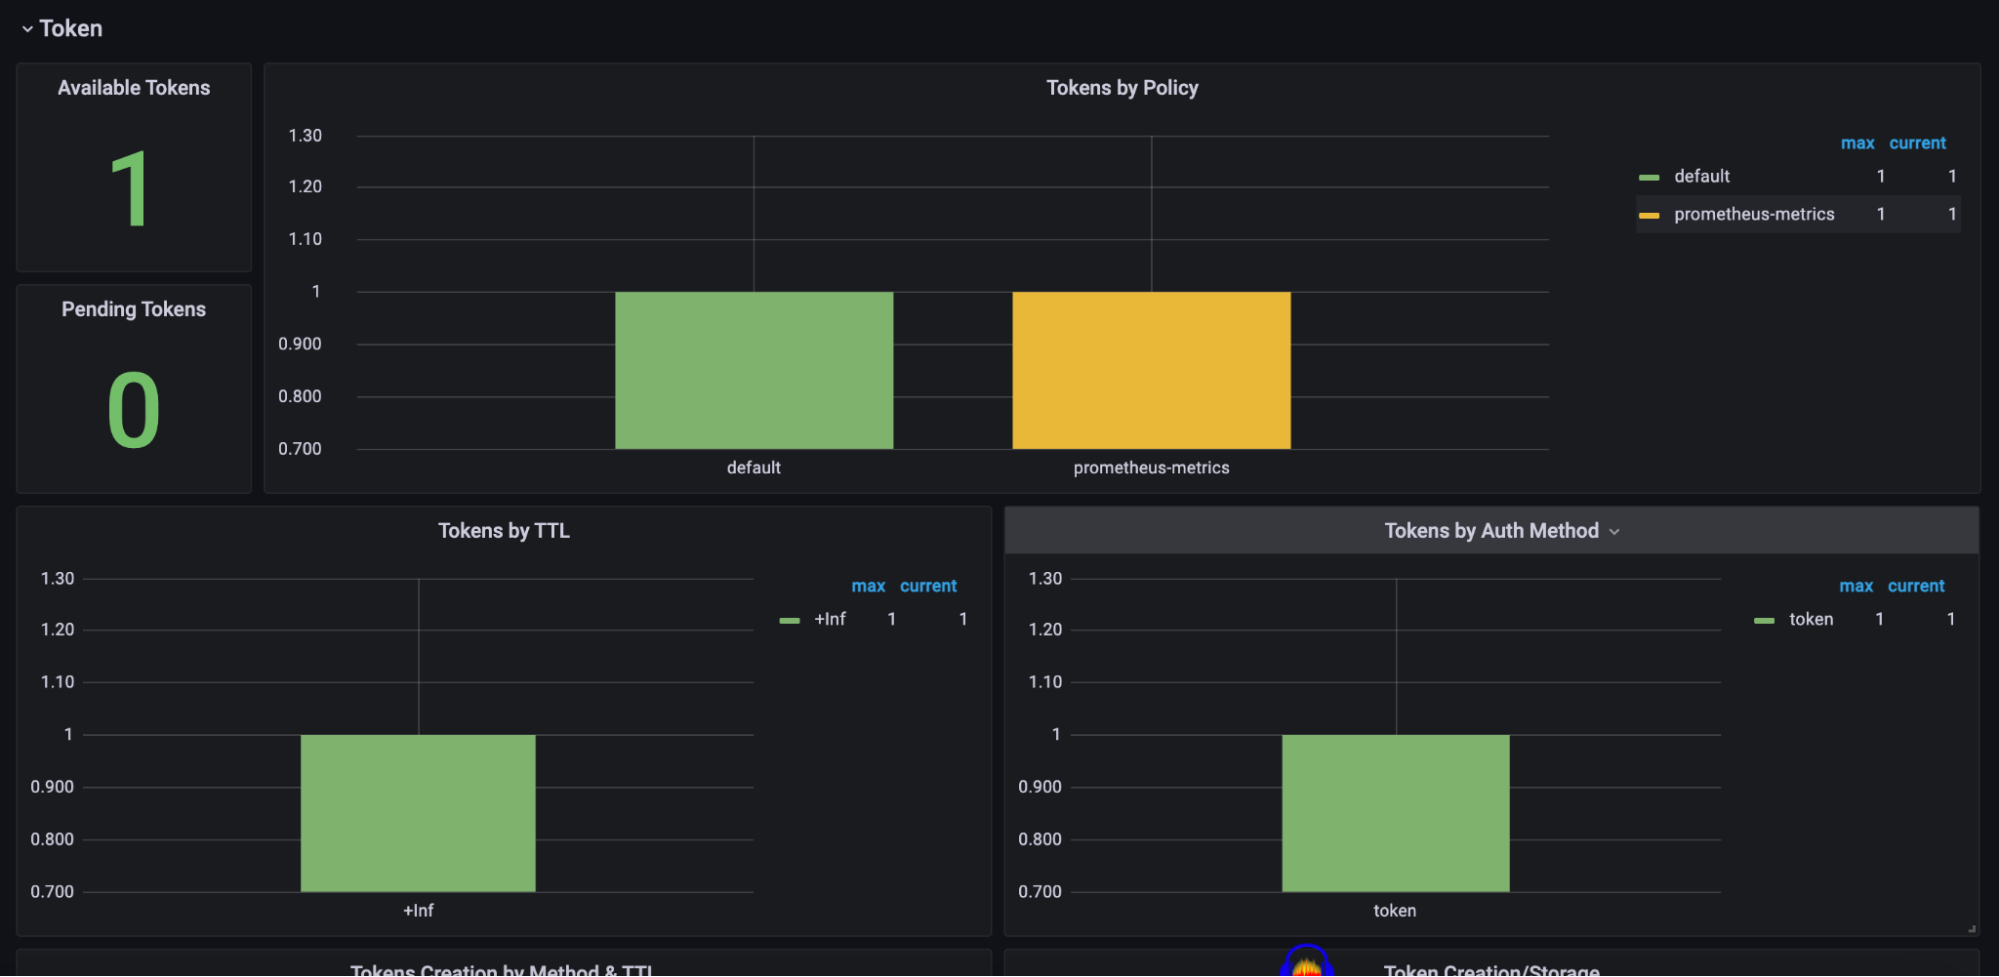
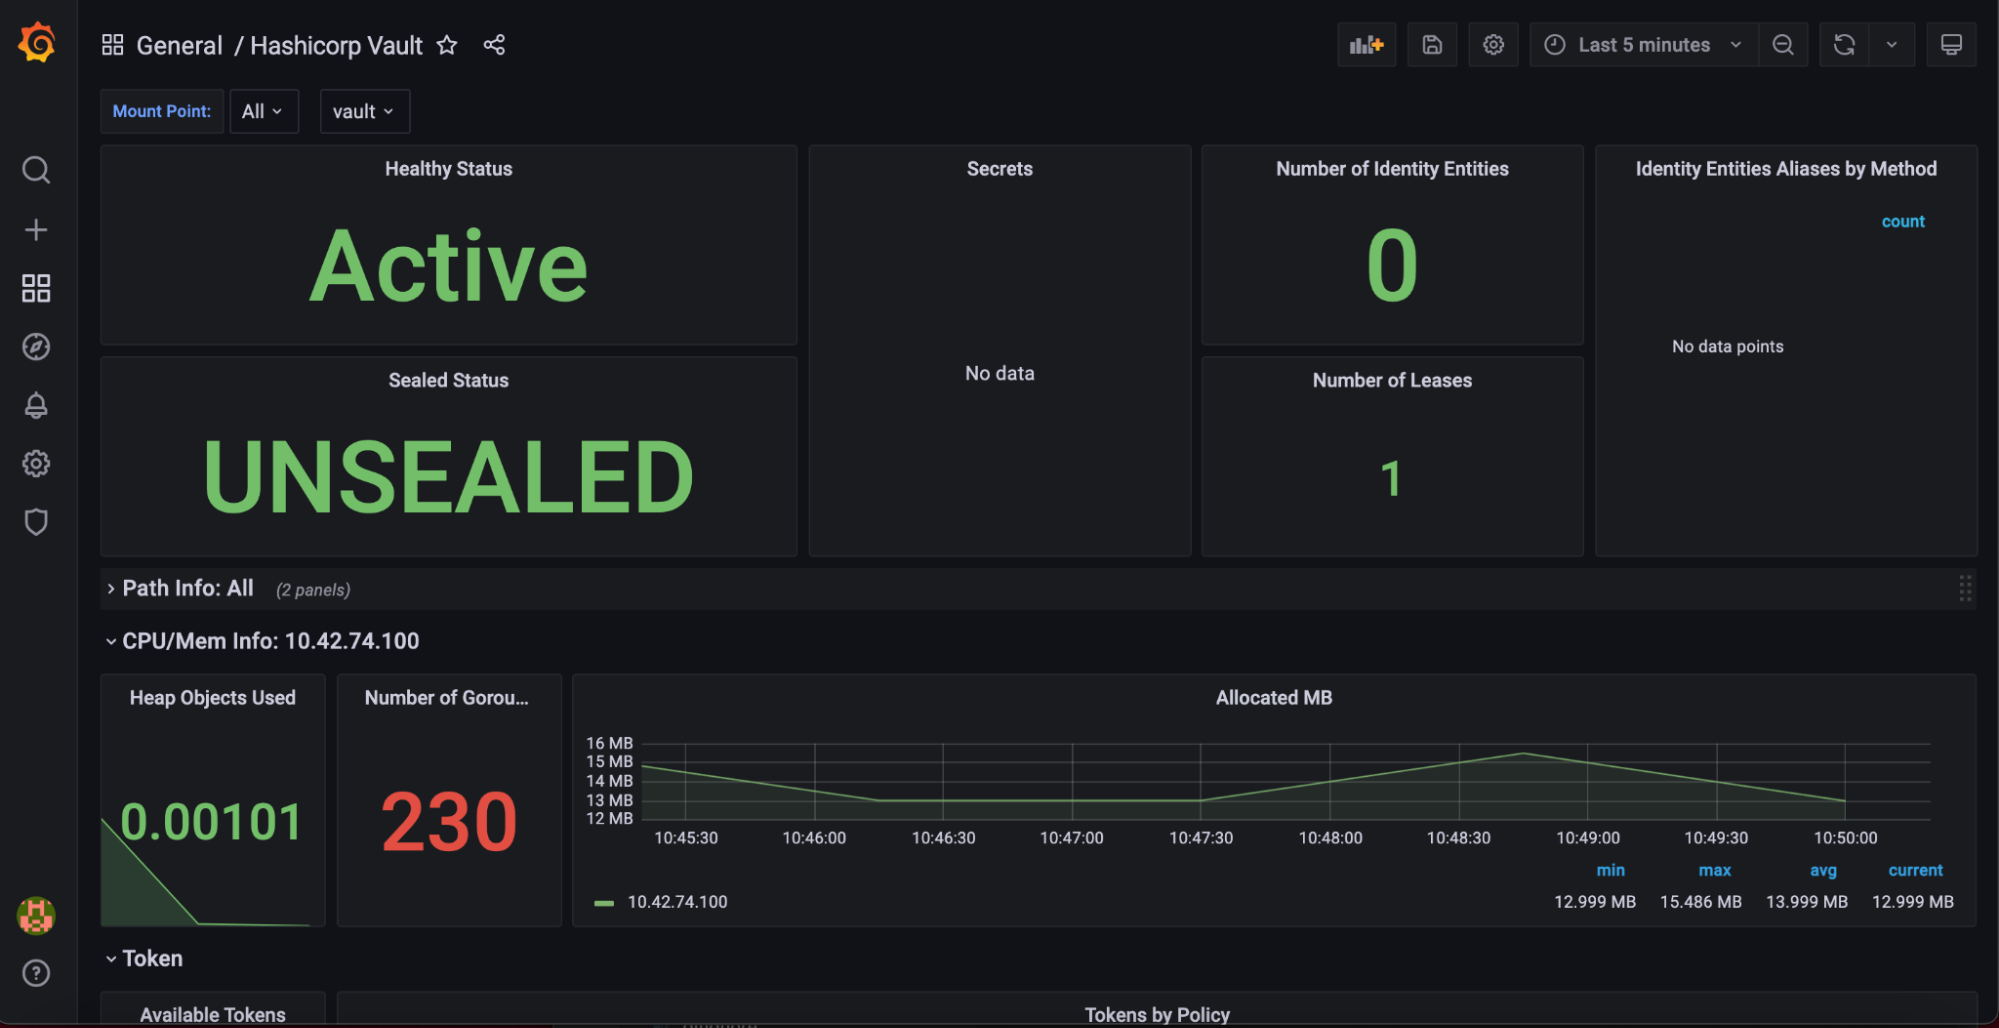
Grafana Cloud is the easiest way to get started with observability, and there’s an actually useful free tier that includes 10k Prometheus metrics, 50GB Loki logs, 50GB Tempo traces, and 3 users. You can sign up for free now.
Monitoring self-managed Vault telemetry with Prometheus and Grafana
For operators with self-managed Vault, operational and usage insight into a Vault cluster is invaluable for understanding performance, business workloads, and use cases, as well as assisting with proactive incident response. This information can alert operations teams to potential performance implications in production or urgent security issues. Vault provides rich operational telemetry metrics, and the Vault education team has created this new tutorial for setting up Vault telemetry for Grafana visualization and Prometheus monitoring.

