How Changelog monitors and optimizes website performance with Grafana Cloud
Developers around the world get their news from Changelog, an indie media company on a mission to create inspiring content for software developers. Through their popular podcasts, including The Changelog, Go Time, JS Party, and Ship It!, the team at Changelog helps listeners stay up-to-date on the latest happenings, trends, and tools in a constantly evolving industry.
With scores of visitors from around the world downloading podcasts and interacting with website content across time zones, monitoring Changelog.com’s performance and identifying issues quickly is a top priority for Site Reliability Engineer Gerhard Lazu.
Gerhard’s original monitoring setup generated alerts but no metrics to illuminate root causes or facilitate resolution. He started building Grafana dashboards and loved the visibility Grafana and Prometheus provided into the Changelog’s entire system. It was so easy to build dashboards, he found himself with five or six. “Trying to think about what I want my dashboard to say, the story that I wanted it to tell — that was a great approach for me,” Gerhard says. “And Grafana made it easy.”

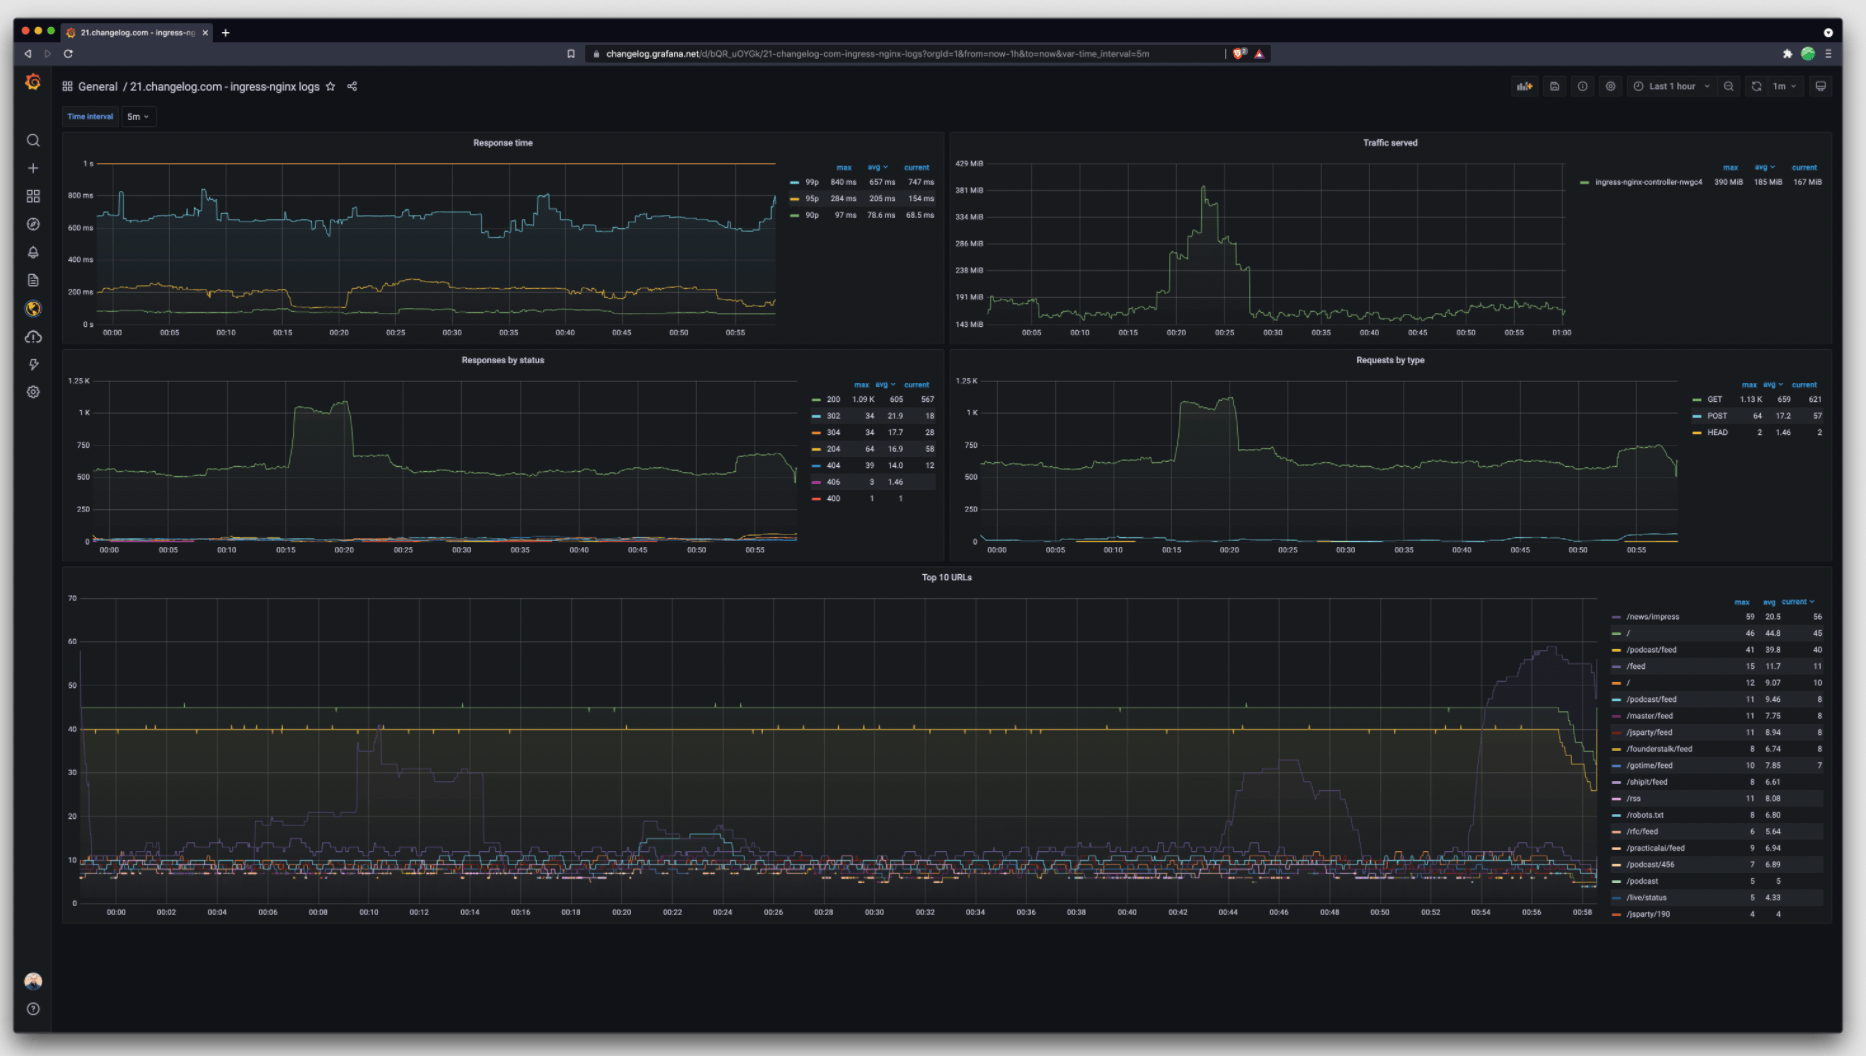
A look at Changelog.com’s NGINX log-based web traffic dashboard.
Scaling painlessly with Grafana Cloud
After adding Grafana Loki, Grafana Labs’s open source log aggregation tool, to his monitoring setup, Gerhard was getting better and more robust visibility into the setup at Changelog.com.
When Grafana rolled out a free tier for Grafana Cloud, it was a natural fit. Moving to a managed service meant that Changelog could keep their robust monitoring setup and save even more time by leaving the upgrades, fixes, and maintenance to Grafana. “It didn’t make sense for us to run it ourselves,” says Gerhard. “Not that it was difficult, but it is much easier to just run the Grafana Agent. That’s all you need. Send everything to Grafana Cloud and it just works.”
The perks of synthetic monitoring and robust alerting
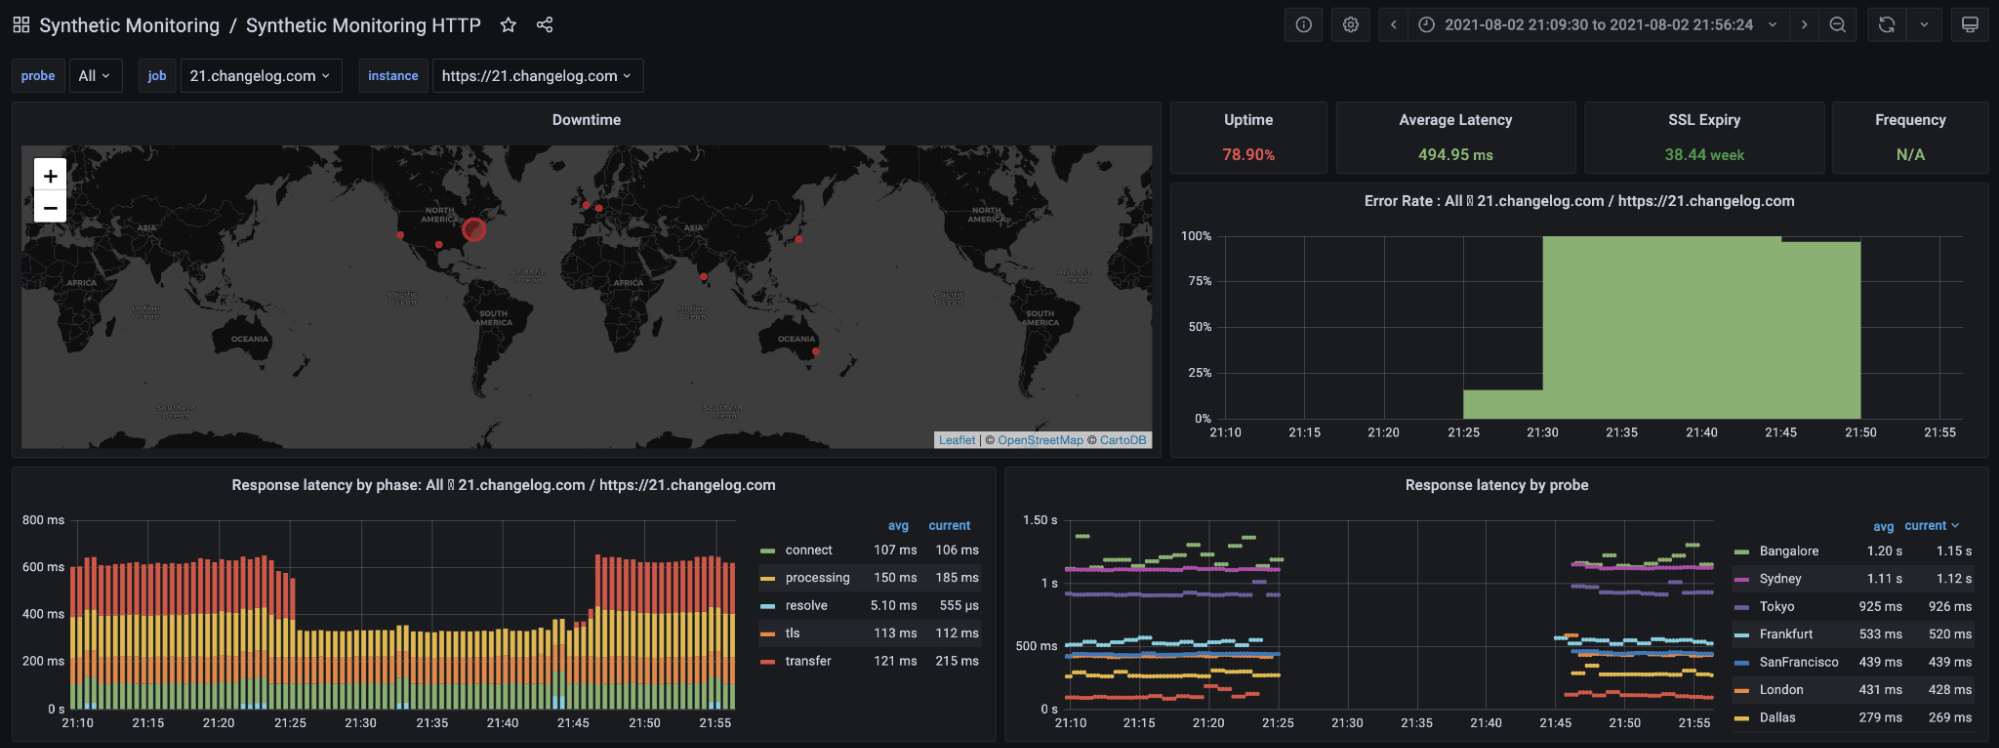
One huge advantage is Grafana Cloud’s built-in synthetic monitoring. Synthetic monitoring probes give Gerhard insight into how the Changelog.com setup is behaving from an external point of view. Using probe locations around the world, he can monitor the availability, performance, and correctness of Changelog.com services for users everywhere. Incidents that previously took much longer to resolve (or were never even detected) take just a few minutes. Overall, he’s seen a MTTR reduction of about 3x, says Gerhard.


A look at Changelog’s Origin Synthetic Monitoring HTTP dashboard.
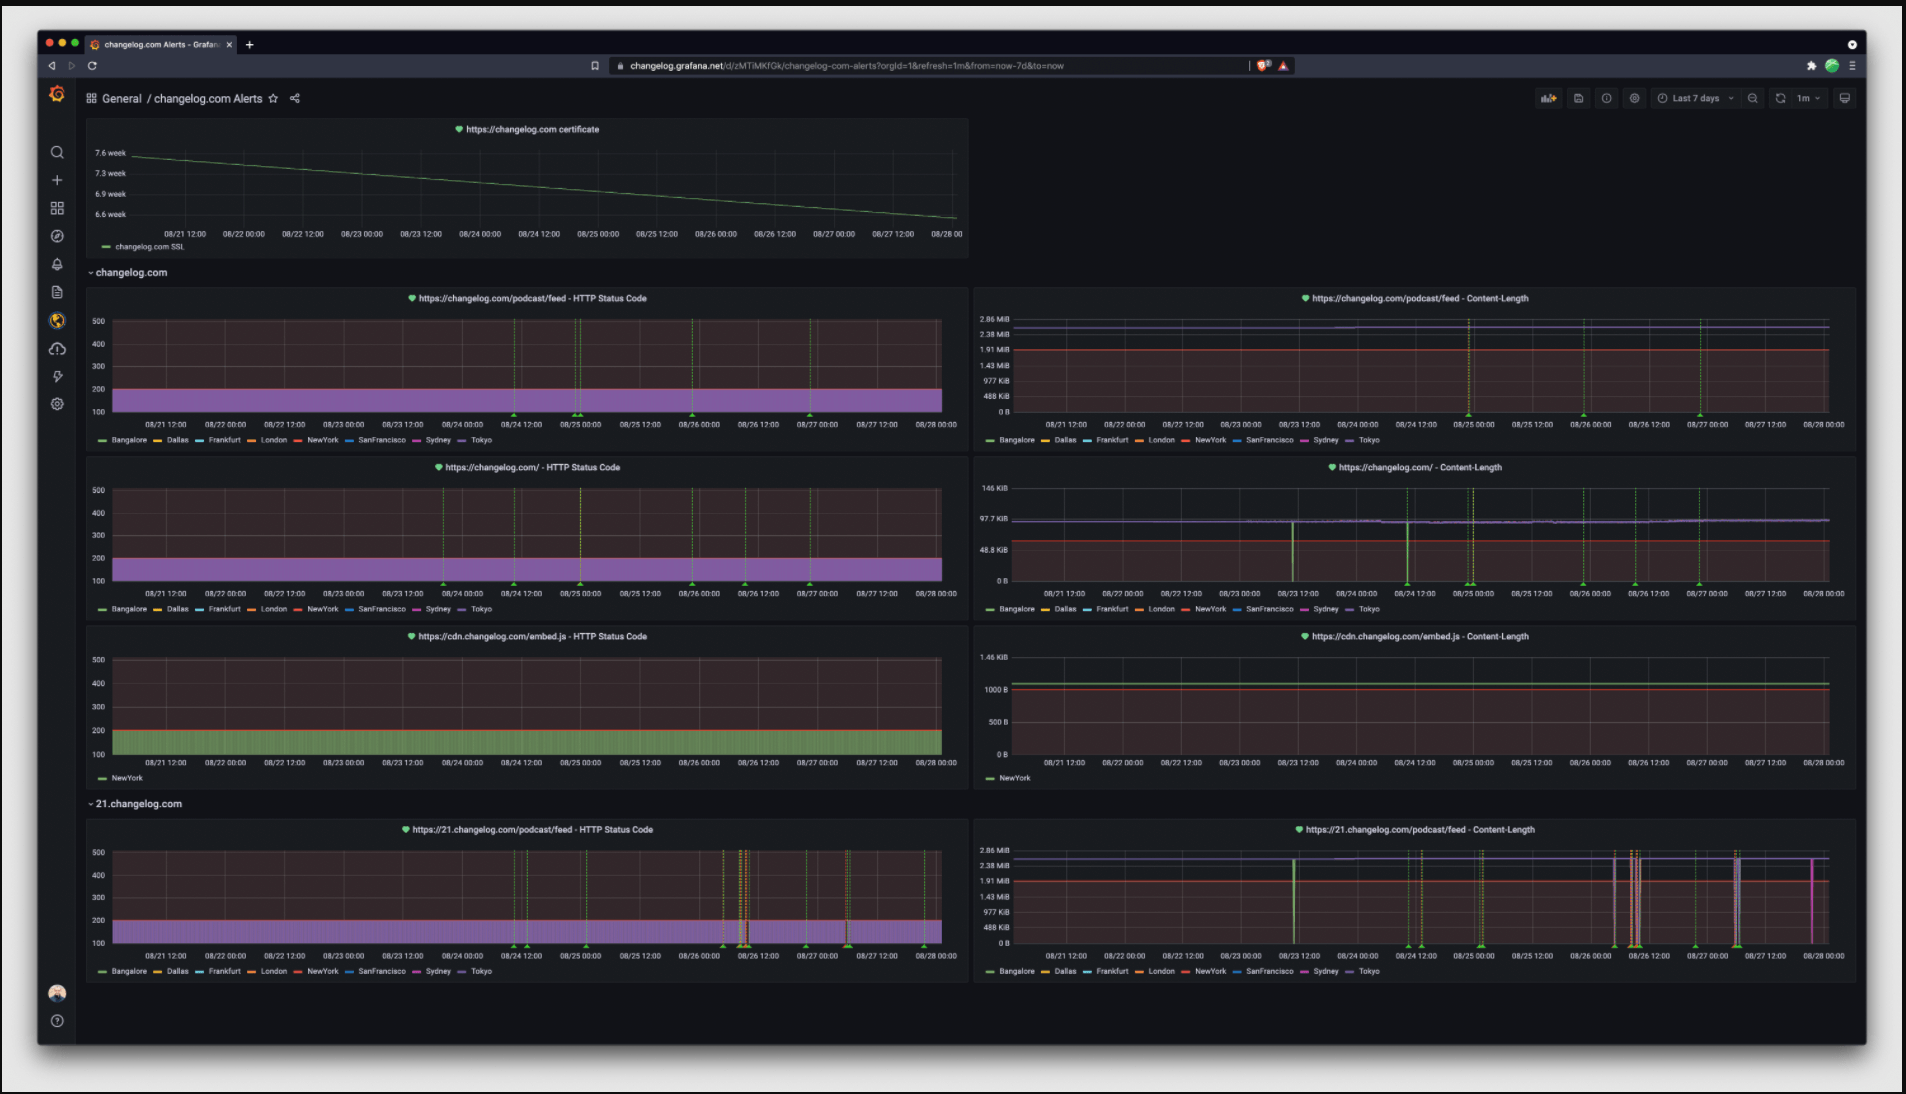
Gerhard also appreciates the robust alerting features that Grafana Cloud brings to the table. By integrating Changelog.com alerts with Telegram, the team has multiple alerting channels. And with Grafana Cloud, he knows the entire Grafana team is there, backing him up every step of the way.

A look at Changelog.com’s alerts dashboard.
The road ahead
Now that Gerhard doesn’t have to spend so much time maintaining his monitoring setup, he’s able to think about Changelog’s infrastructure in a whole new way. The sky’s the limit for infrastructure changes because monitoring is handled elsewhere. Migrating to Grafana Cloud has made things more flexible and accessible and a lot of hard stuff simpler, he says.
Get all the details on Changelog’s migration to Grafana Cloud and see what else is in the works for their team in the full success story.
The easiest way to get started with Grafana, Prometheus, Loki for logging, and Tempo for tracing is Grafana Cloud, and we’ve recently added a new free plan and upgraded our paid plans. If you’re not already using Grafana Cloud, sign up today for free and see which plan meets your use case.


