How to monitor a Ceph cluster using Grafana Cloud
Here at Grafana Labs, when we’re building integrations for Grafana Cloud, we’re often thinking about how to help users get started on their observability journeys. We like to focus some of our attention on the different technologies you might come across along the way. That way, we can share our tips on the best ways to interact with them while you’re using Grafana products.
In this post, I’m going to focus on the open-source, distributed storage system Ceph, our latest integration available in Grafana Cloud (including the forever-free tier).
The basics
Ceph implements object storage on a single distributed computer cluster, then provides 3-in-1 interfaces for object, block, and file-level storage. The goal is to offer a completely distributed operation without a single point of failure, which allows you to have availability and the option to scale.
In order to achieve these goals, it’s important that the cluster has redundant nodes of each core component, namely OSD (Object Storage Daemons) and MDS (Metadata Server Daemon). This ensures data is replicated in multiple nodes, so that if one fails you won’t lose data. The same applies to the metadata nodes, which control the overall configuration of your cluster.
That being said, in order to properly monitor a Ceph cluster, we have to focus on these two core components, which are key for a sharp deployment.
Observing Ceph
This integration monitors a Ceph cluster based on the built-in Prometheus plugin.
First, enable it with the following command in your cluster:
ceph mgr module enable prometheus
Then, you’ll need to configure the Grafana Agent to scrape your Ceph nodes. (Please refer to the integration documentation here for more details.)
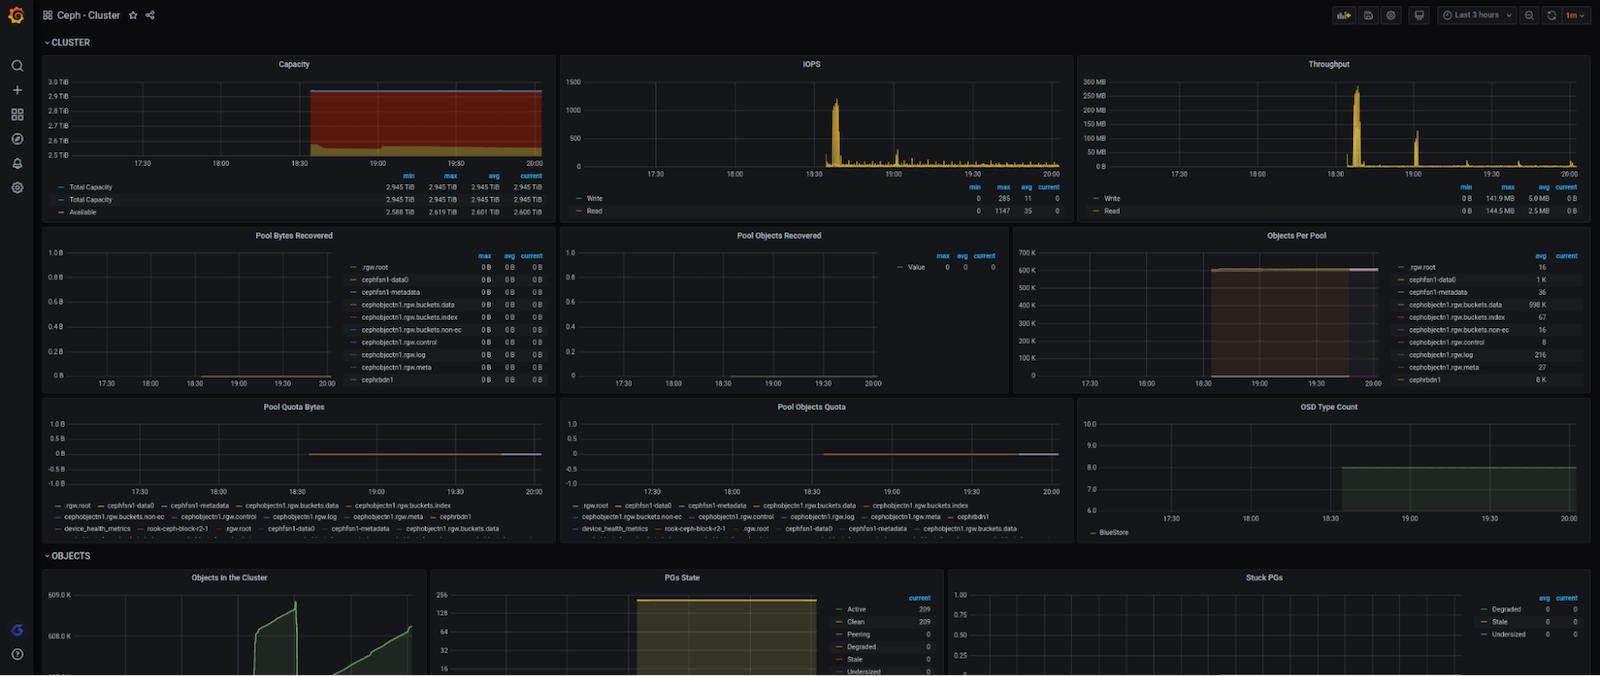
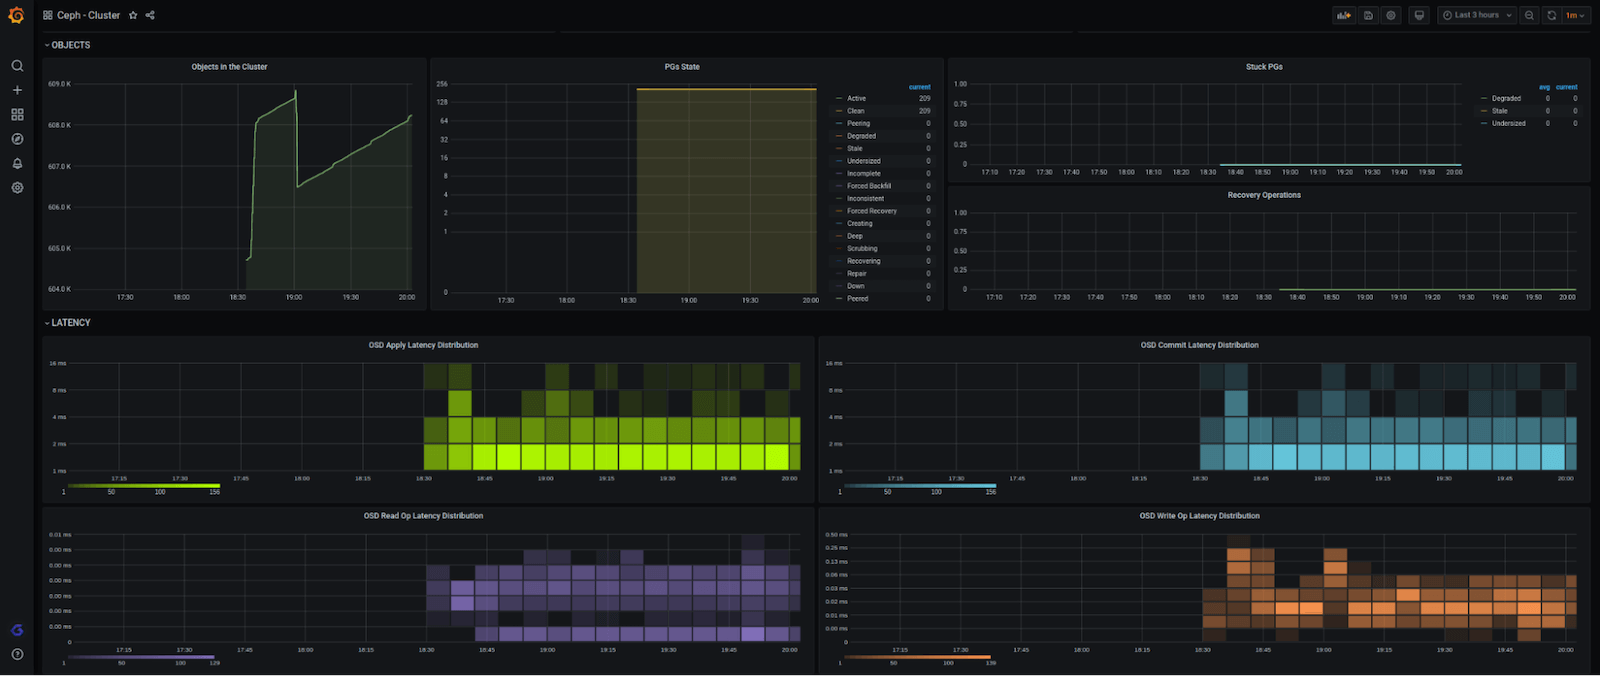
The integration is composed of a single and complete dashboard, which summarizes all the information of a Ceph cluster in a single glance. It includes overall cluster information, including number of OSD and monitors nodes up/down; bytes and written/read and write/read throughput rate; IOPS; cluster available; used and overall capacity; latency currency rate and distribution; and more.
Here’s what the full dashboard looks like (in four pieces):


We also wanted to make sure that you get notified when something is wrong with your cluster, so we created these alerts:
- CephUnhealthy (based on the overall healthiness metric ceph_health_status — if this metric doesn’t exist or it returns something different from 1, the cluster is having critical issues)
- CephDiskLessThan15Left (alerts a warning if there’s less than 15% of capacity left in the cluster)
- CephDiskLessThan5Left (alerts a critical if there’s less than 5% of capacity left in the cluster)
- OSDNodeDown (alerts a warning if any OSD node is down)
- MDSDown (alerts a critical if there’s no MDS available in the cluster)
Together with the dashboard, those alerts are a very good way to start monitoring your cluster in a plug-and-play fashion — it will only take you a few minutes to get it up to speed, which is our main goal.
Give our Ceph integration a whirl and let us know what you think. You can reach out to us in our Grafana Slack Community via #Integrations.
Grafana Cloud is the easiest way to get started with metrics, logs, traces, and dashboards. We have a generous forever-free tier and plans for every use case. Sign up for free now!


