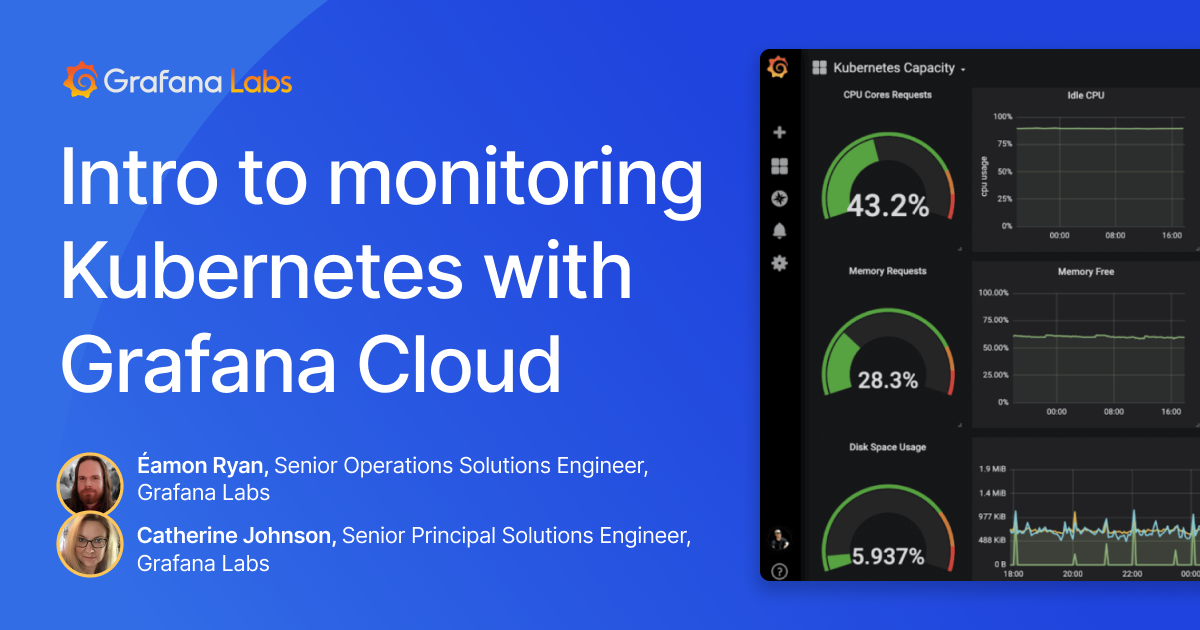
Learn all the basics about monitoring Kubernetes with Grafana Cloud in this week's webinar
Are you running Kubernetes? Are you overwhelmed by the amount of telemetry you are gathering? Are you not yet gathering anything at all?
Whether you’re running simple or more complex Kubernetes clusters, it’s easy to amass hundreds of gigabytes of logs, metrics, and traces every day. Making sense of it all is where the real challenge begins.
For some easy solutions, tune into our “Intro to monitoring Kubernetes with Grafana Cloud” webinar on Thursday, Oct. 21 at 9:30 PDT / 12:30 EDT / 16:30 UTC to learn how to parse through all the telemetry of Kubernetes with Grafana Cloud and seamlessly monitor and alert on core Kubernetes cluster metrics using the Grafana Agent.

In this introductory session, Éamon Ryan, Senior Operations Solutions Engineer at Grafana Labs, and Catherine Johnson, Senior Principal Solutions Engineer at Grafana Labs, will break down the basics about Kubernetes and walk through how Grafana Cloud can help visualize all the data on your cluster and give you a better read on the health of your systems.
The Grafana Labs team will also demo how to correlate between metrics, logs and traces on the fly, and how to use the Kubernetes mixin to access your Grafana dashboards and configure important alerts and recording rules.
We hope you’ll join us!
Grafana Cloud is the easiest way to get started with metrics, logs, traces, and dashboards. We have a generous forever-free tier and plans for every use case. Sign up for free now!


