New in Grafana 8.2: Test contact points for alerts before they fire
Grafana 8.2 was released last week, and we’re excited to announce one of its new features: contact point testing. Now users of Grafana 8 alerting can test their contact points right from the contact points page. This feature makes it easier to configure Grafana 8 alerting and gives you the confidence in knowing that your contact points are working as expected before they fire.
Here are the basics:
What are contact points?
Contact points contain configuration for zero or more contact point types (i.e. email, Slack, webhook, etc.) that receive notifications when an alert is firing. A contact point is not limited to just one contact point type and can have multiple contact point types.

How to test a contact point in Grafana 8.2
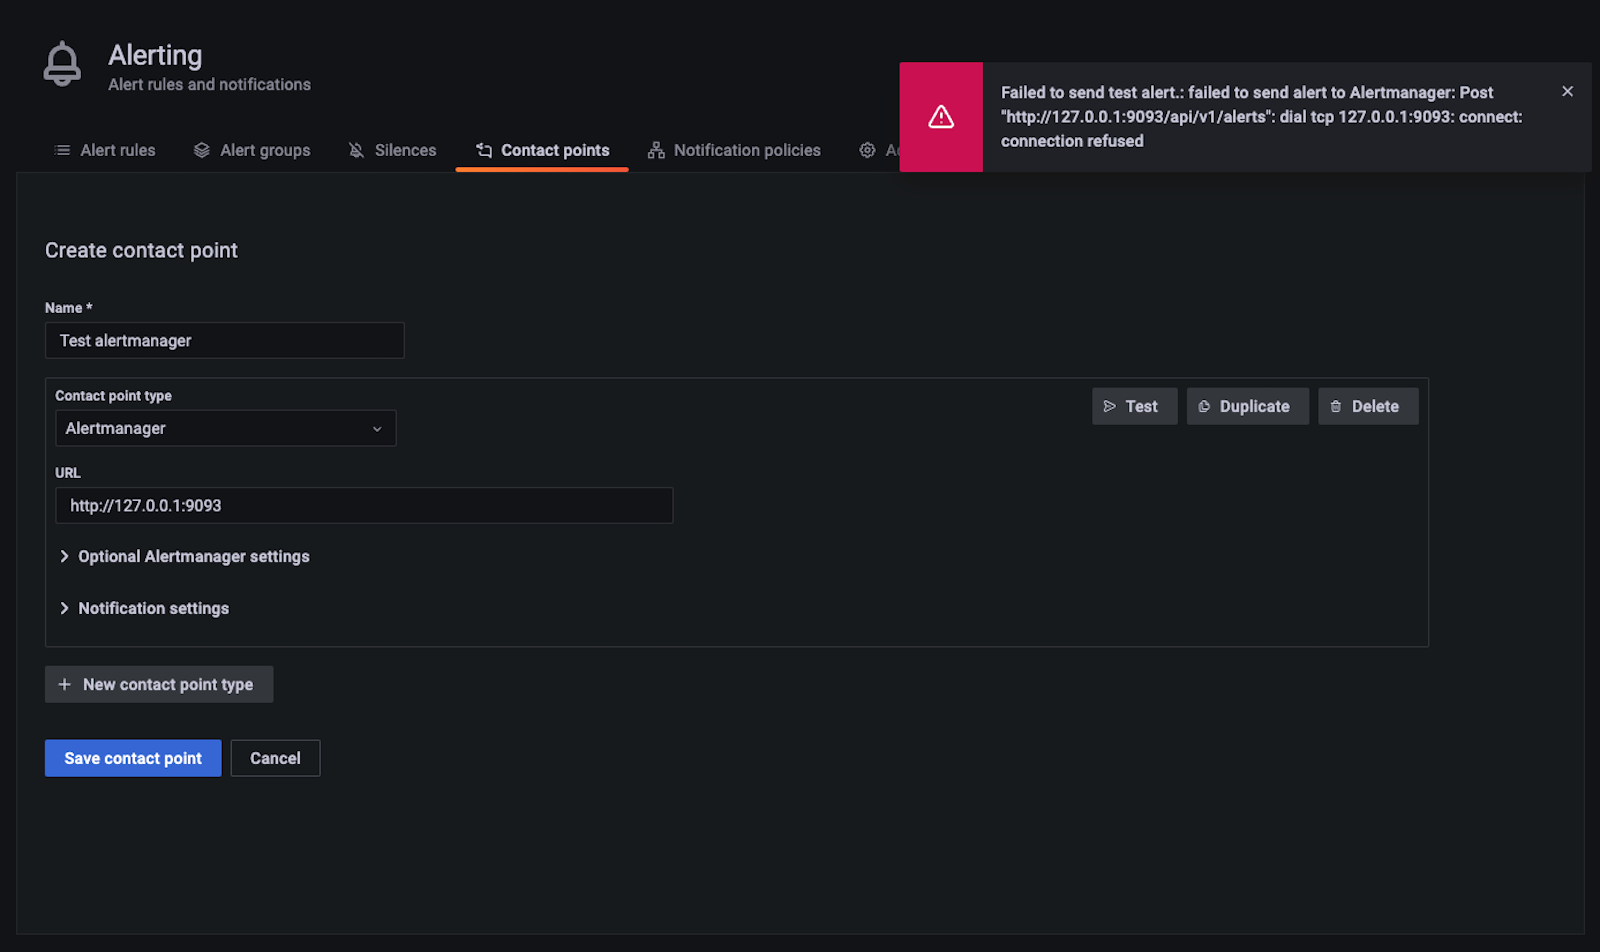
When you’re creating or updating a contact point type for new and existing contact points, you’ll notice that in Grafana 8.2, we have added a new Test button next to the Duplicate and Delete buttons.

When the Test button is clicked, Grafana creates an alert called TestAlert and sends a notification for this alert to the contact point type. The important difference here is that unlike in Grafana 8.1 and earlier, the contact point does not need to be saved or assigned to one or more notification policies in order to be tested.
If the contact point type is valid and the notification was sent without error, the user interface will show a green success dialogue with the message “Test alert sent.”

However, if the contact point does not contain valid configuration or the notification could not be sent to the contact point, the user interface will show a red error dialogue with the message “Failed to send test alert,” along with the error message.

Testing contacts points with the Grafana API
There is also an API endpoint that can be used to test contact points:
POST /api/alertmanager/grafana/config/api/v1/receivers/test
The endpoint accepts JSON containing a list of receivers in the same format we expect when making a POST request to api/alertmanager/grafana/config/api/v1/alerts:
{
  "receivers": [{
    "name": "contact-point-1",
    "grafana_managed_receiver_configs": [{
      "name": "alertmanager",
      "type": "prometheus-alertmanager",
      "settings": {
        "url": "http://127.0.0.1:9093"
      }
    }, {
      "name": "email",
      "type": "email",
      "settings": {
        "addresses": "example@example.com"
      }
    }]
  }]
}
The API returns an HTTP 200 OK response with the list of receivers (name and UID) that were tested. A timestamp is included in the notification to differentiate between successive tests.
{
  "notified_at": "2021-01-01T00:00:00Z",
  "receivers": [{
    "name": "contact-point-1",
    "grafana_managed_receiver_configs": [{
      "name": "alertmanager",
      "uid": "uid1",
      "status": "ok"
    }, {
      "name": "email",
      "uid": "uid2",
      "status": "ok"
    }]
  }]
}
If a receiver was successful in sending a notification, it will contain a status field with “ok.” If a receiver failed — either due to misconfiguration or an ephemeral error — it will contain a status field with “failed” and an error field with a message.
{
  "notified_at": "2021-01-01T00:00:00Z",
  "receivers": [{
    "name": "alertmanager",
    "grafana_managed_receiver_configs": [{
      "name": "alertmanager",
      "uid": "uid1",
      "status": "ok"
    }, {
      "name": "email",
      "uid": "uid2",
      "status": "failed",
      "error": "SMTP is not configured"
    }]
  }]
}
All contact points are tested in parallel (at most 10 at a time) and have a default timeout of 15 seconds, configurable up to a maximum of 30 seconds.
Try it out!
Contact point testing is available both in Grafana 8.2 and Grafana Cloud. Users setting up a new Grafana Cloud instance will have access to the latest version of Grafana and this feature. More information on contact points and Grafana 8 alerting can be found in the official documentation here.
You can get started with Grafana in minutes with Grafana Cloud. We have free and paid Grafana Cloud plans to suit every use case — sign up for free now.


