Grafana 8.2 released: Dynamic plugin catalog, new fine-grained access control permissions, and more
Grafana 8.2 is here!
This release marks the start of our work focused on measurable improvements to Grafana’s accessibility — part of our continuing mission to democratize metrics for everyone. The initial changes to Grafana in 8.2 are focused on navigation, with more to come. We’ll be sharing more about our accessibility roadmap in an upcoming blog post.
Grafana 8.2 also includes our new plugin catalog and the ability to configure fiscal years and quarters in the time range controls. Grafana Enterprise includes a revamped Stats and Licensing page, new fine-grained access control permissions, and improvements that make usage insights and reporting easier to access.
You can get started with Grafana in minutes with Grafana Cloud. We have free and paid Grafana Cloud plans to suit every use case — sign up for free now.
Here’s a closer look at the main new features in 8.2.
A dynamic plugin catalog and plugin experience
Now on by default in Grafana 8.2, the plugin catalog allows Grafana users to find and install plugins directly from within Grafana — all without a restart. The plugin catalog also enables simplified plugin management by making it easy to distinguish between installed plugins and all available plugins. Plugins can be uninstalled without a restart as well.

Define and select fiscal years and quarters
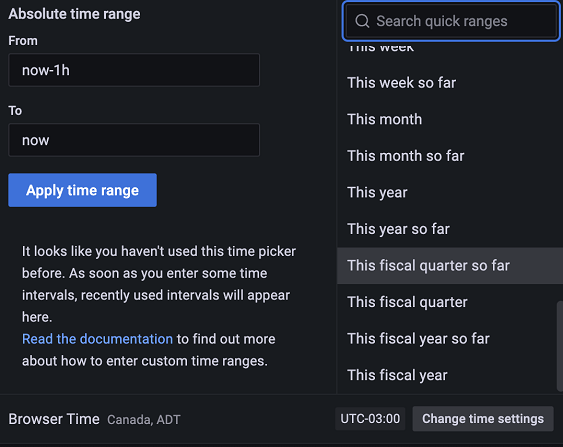
Grafana 8.2 includes a significant change to the time range menu. It now includes the ability to set the start month of your organization’s fiscal year. This enables configurable fiscal year and fiscal quarter time range for use cases that require it. It can be especially helpful for Go To Market, Finance, BizOps or executive dashboards and equally valuable for SLA and SLO use cases.


As the options for the time ranges have grown, we’ve also included a search for the quick time rangers to further speed up your workflows.
Image renderer performance tuning
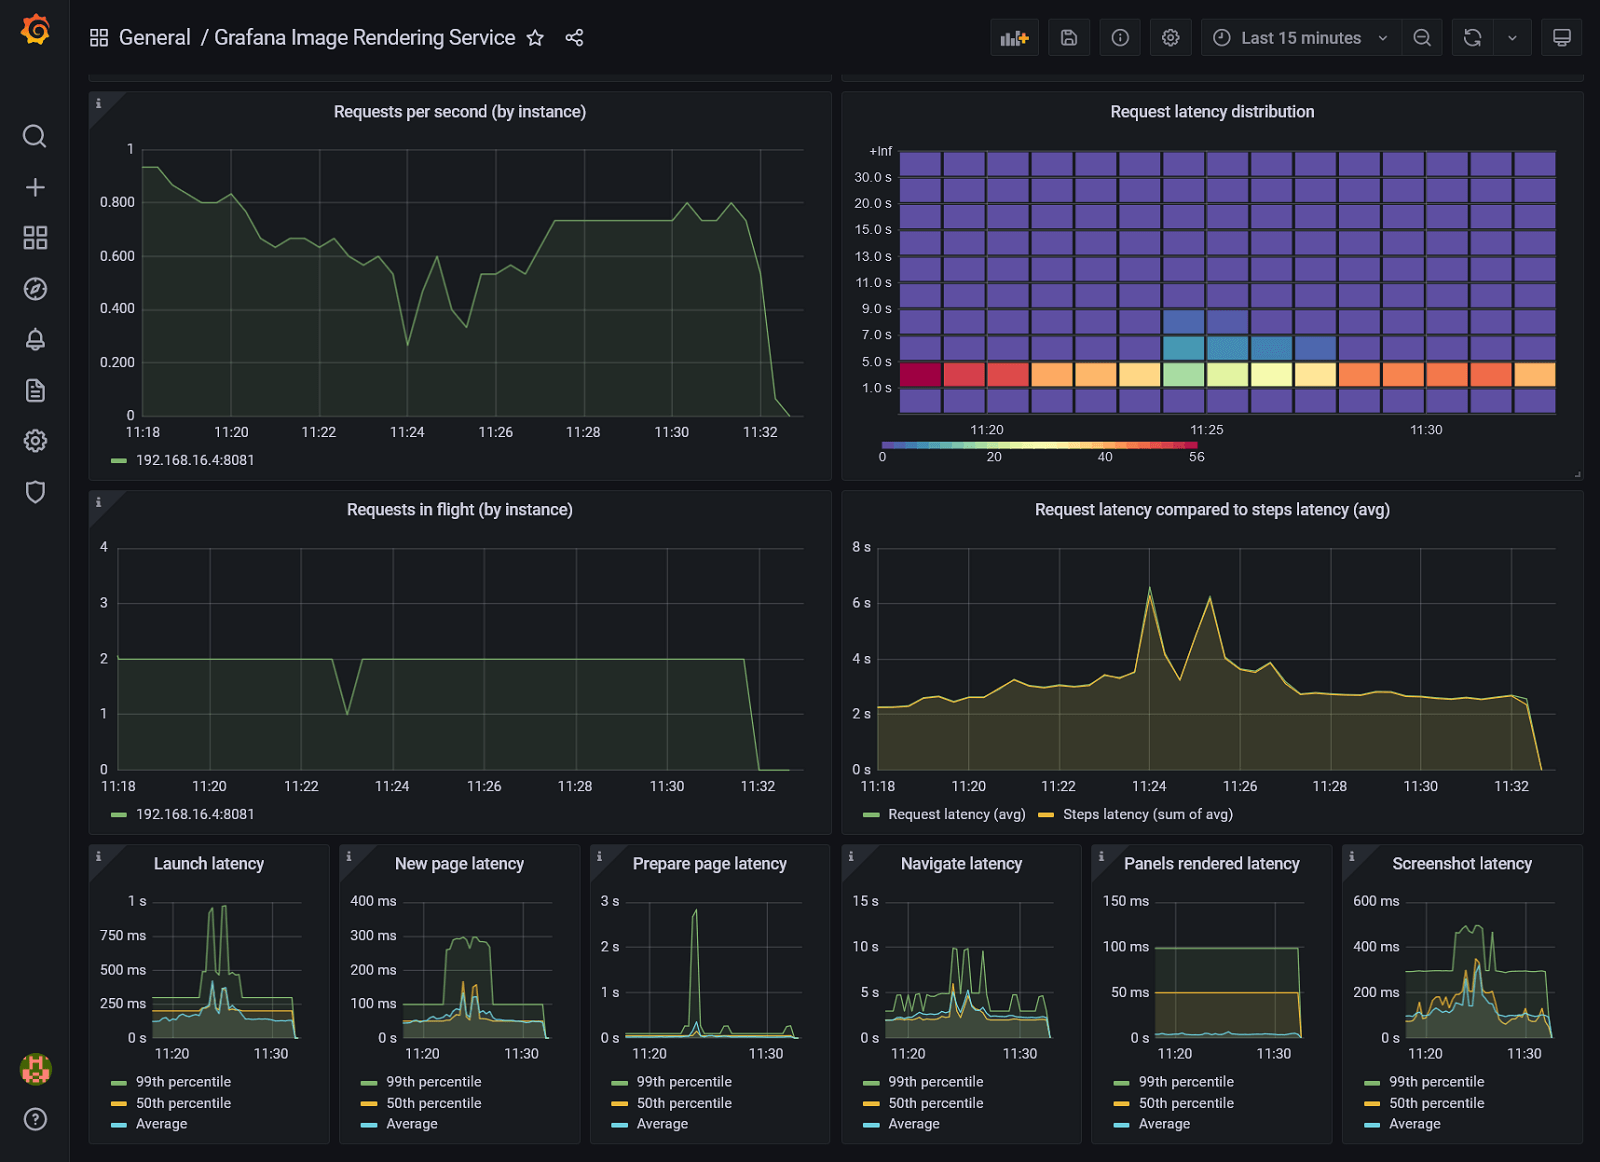
You can use Grafana’s image renderer to generate images of panels and dashboards. Grafana uses these images for alert notifications, PDF exports in Grafana Enterprise, and reports sent by Grafana (an Enterprise feature). We’ve added additional metrics to the image renderer to help you diagnose its performance, and included guidance in our documentation to help you configure it for the best mix of performance and resource usage. By following this guidance, we were able to reduce image load time from a 95th percentile of up to 20 seconds to less than 5 seconds with 10 images rendered concurrently. You can learn more about the image renderer and performance tuning in the docs.

New features in Grafana Enterprise
Grafana Enterprise includes a revamped Stats and Licensing page, new fine-grained access control permissions, and improvements that make usage insights and reporting easier to access.
Understand your user counts and license with combined stats display
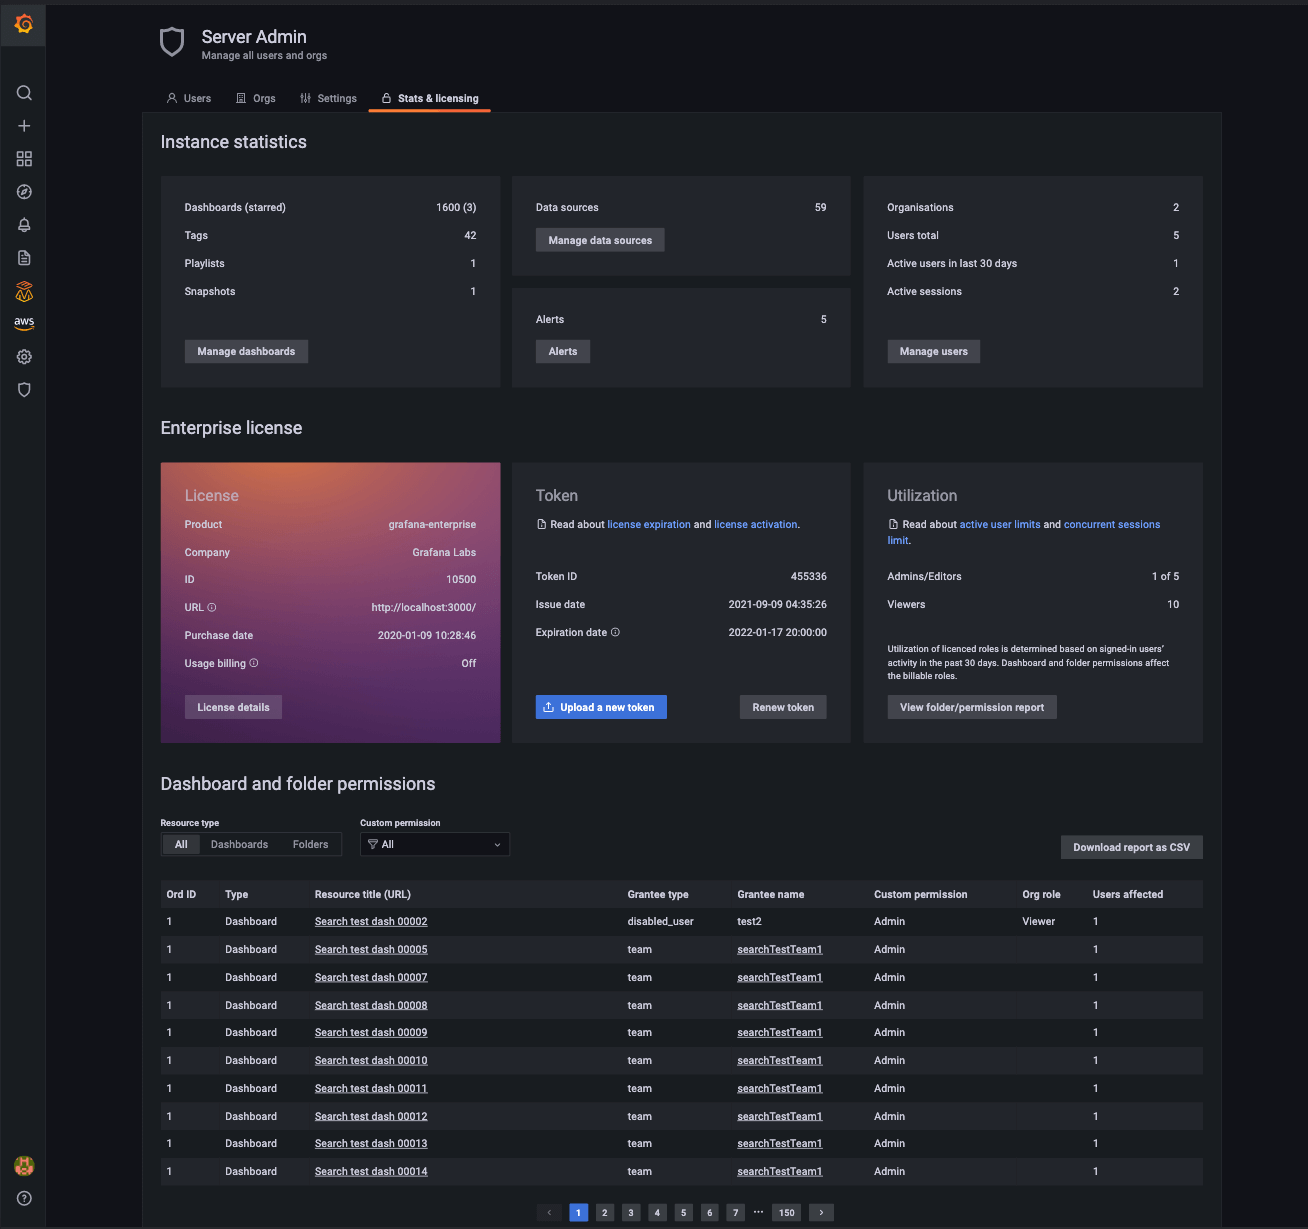
The Stats and License sections of Grafana Enterprise include a new combined screen, which makes it easier to understand a license’s term and user counts, and find out early when you need to renew or expand a license. It’s easier to parse Grafana statistics like the number of dashboards, data sources, and alerts in a given instance. This screen also includes an interactive list of dashboard and folder permissions, which can affect your users’ licensed roles in Grafana.

The Users page in the Server Admin section also displays each user’s licensed role. You can use this to see how each user is counted for licensing purposes, based on their organization roles and dashboard or folder permissions.

New data source and provisioning permissions
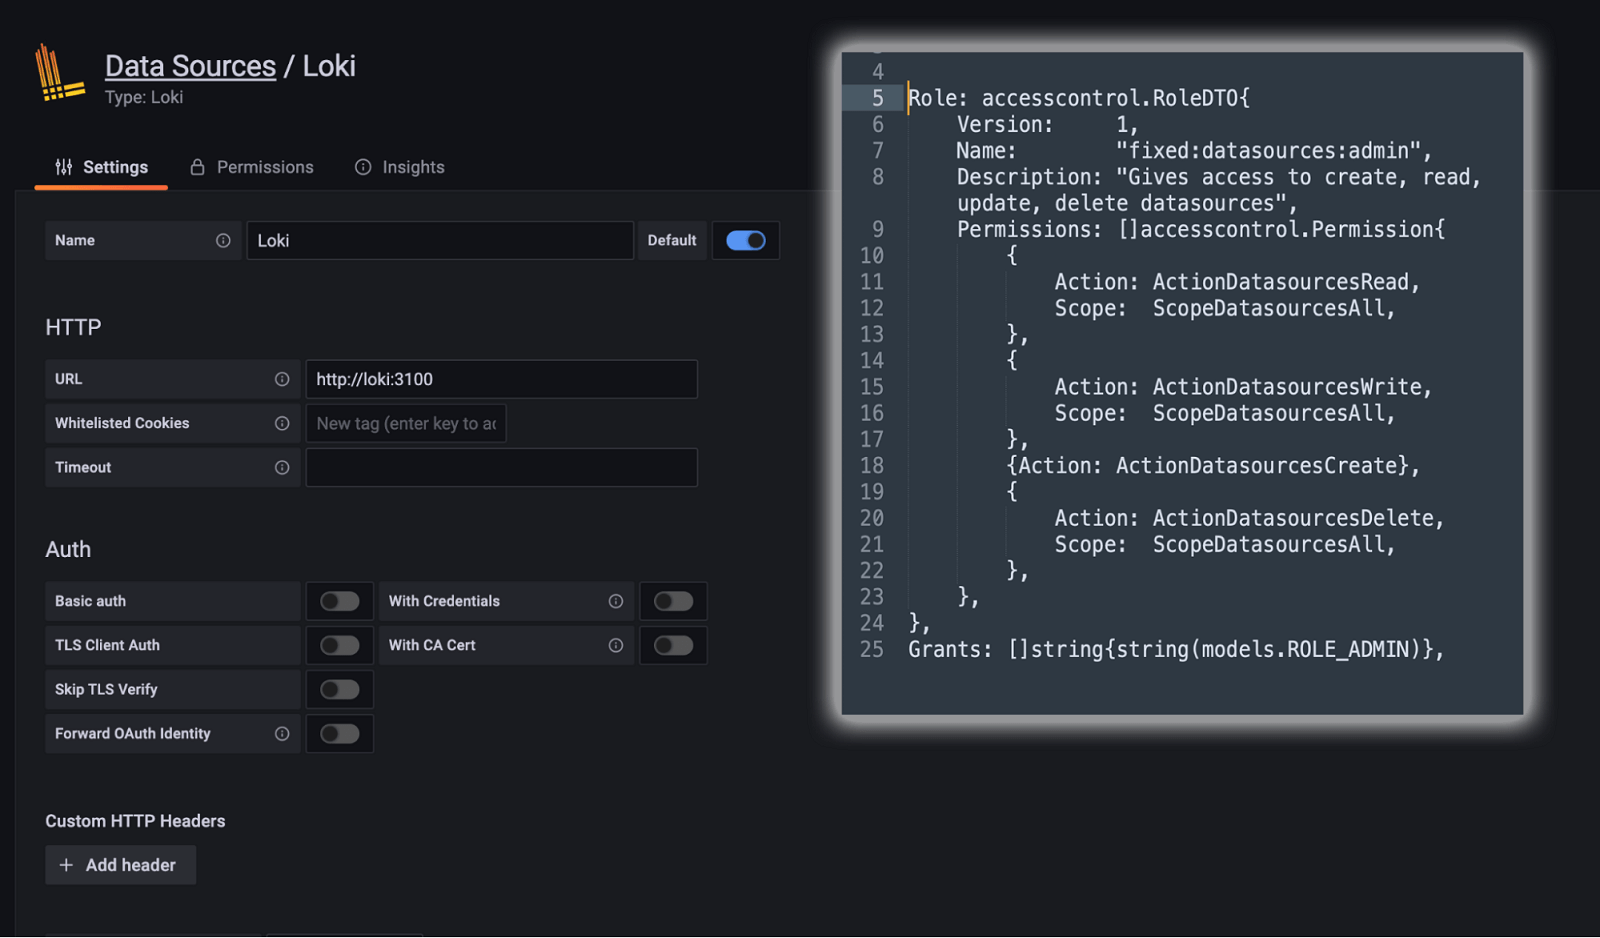
New fine-grained access control permissions now cover data source and provisioning permissions. You can decide which roles (Viewers, Editors, and Admins) can manage data sources and data source permissions in Grafana, and which roles can reload provisioning configuration for dashboards, data sources, and other provisioned resources. We’ll continue adding fine-grained access control to more Grafana services, like dashboards and API keys, in upcoming releases.

Export usage insights logs as server logs
Usage insights logs contain valuable information about user dashboard visits, queries, and front-end errors that are otherwise impossible to track in Grafana. You can now export those logs alongside your regular server logs to identify problematic dashboards and data sources and improve users’ experience with Grafana. Previously, these metrics could only be exported directly to Loki.

Create a report directly from a dashboard
Reports are a powerful way to deliver insights to people’s email inboxes. Now you can create a report directly from any dashboard using the Share button. This is especially useful combined with fine-grained access control, which allows you to grant Editors or Viewers the ability to create reports in Grafana. Learn more in the documentation about reporting.

Get more information
For a quick overview of more new features, have a look at our What’s new in 8.2 page. For a complete list of new features, changes, and bug fixes, check out the documentation and release notes. Join us on our community forums to discuss any of the new features, workflows, or how to incorporate these changes into your dashboards, queries, and visualizations.
Upgrade Grafana
Download or try Grafana 8.2 in the cloud today.
Refer to Upgrading for more information about upgrading your Grafana installation.
Thanks
A big thanks to all the Grafana users who contributed by submitting PRs, bug reports, and feedback!


