
With the Salesforce plugin for Grafana, easily visualize your SFDC data and correlate it with other data sources
This post has been updated to reflect changes in the availability of the Salesforce data source plugin for Grafana Cloud users.
Good news for Salesforce users: With the new Salesforce plugin for Grafana, which is available for users with a Grafana Cloud account or with a Grafana Enterprise license, you can instantly visualize your SFDC data in Grafana dashboards.
Plus, Grafana allows you to visualize the Salesforce data alongside all sorts of other data. One interesting use case is correlating sales data to system metrics and logs, which would be valuable if your company uses any software systems at all to help generate revenue.
When we think of observing systems, no matter how complex they get, we are ultimately trying to maximize one of two levers: increase revenue or decrease costs. Salesforce is the ultimate tool for describing the revenue pipeline. With the Salesforce plugin for Grafana, you can bring observability to your sales pipeline.
Why correlate sales data with system metrics or logs?
Salesforce is best known as a customer relationship management (CRM) tool; however, it also has features for forecasting, hiring, support, and other business functions. It has always been a 100% SaaS solution, managing production and sandbox instances for customers.
Most companies use Salesforce to track sales opportunities. If a sales pipeline is in any way influenced by …
- Software releases
- Online campaigns
- SaaS services
… then the performance and usage of those systems impact your opportunities and your ability to close deals. For example:
- Poor website performance can cause users to abandon carts.
- A new software release with a new feature drives tons of sales interest.
- An outage costs real dollars by not allowing customers to place orders.
In this blog post, we’ll walk through setting up the Salesforce plugin in Grafana and creating a dashboard that correlates sales data with system metrics.
Setting up the Salesforce data source
In order to use the Salesforce data source, you’ll need a Grafana Cloud account or a Grafana Enterprise license. From there, you’ll:
- Install the plugin.
- Set up a connected app in Salesforce for OAuth.
- Configure the data source in Grafana.
Querying Salesforce data
The Salesforce plugin for Grafana provides three ways to access data in Salesforce:
Native SOQL
For those who are proficient in the Salesforce Object Query Language (SOQL), queries can be written directly in Grafana. To see this behavior, you can go to the Explore panel and choose the Salesforce data source that you have already created:
Query builder
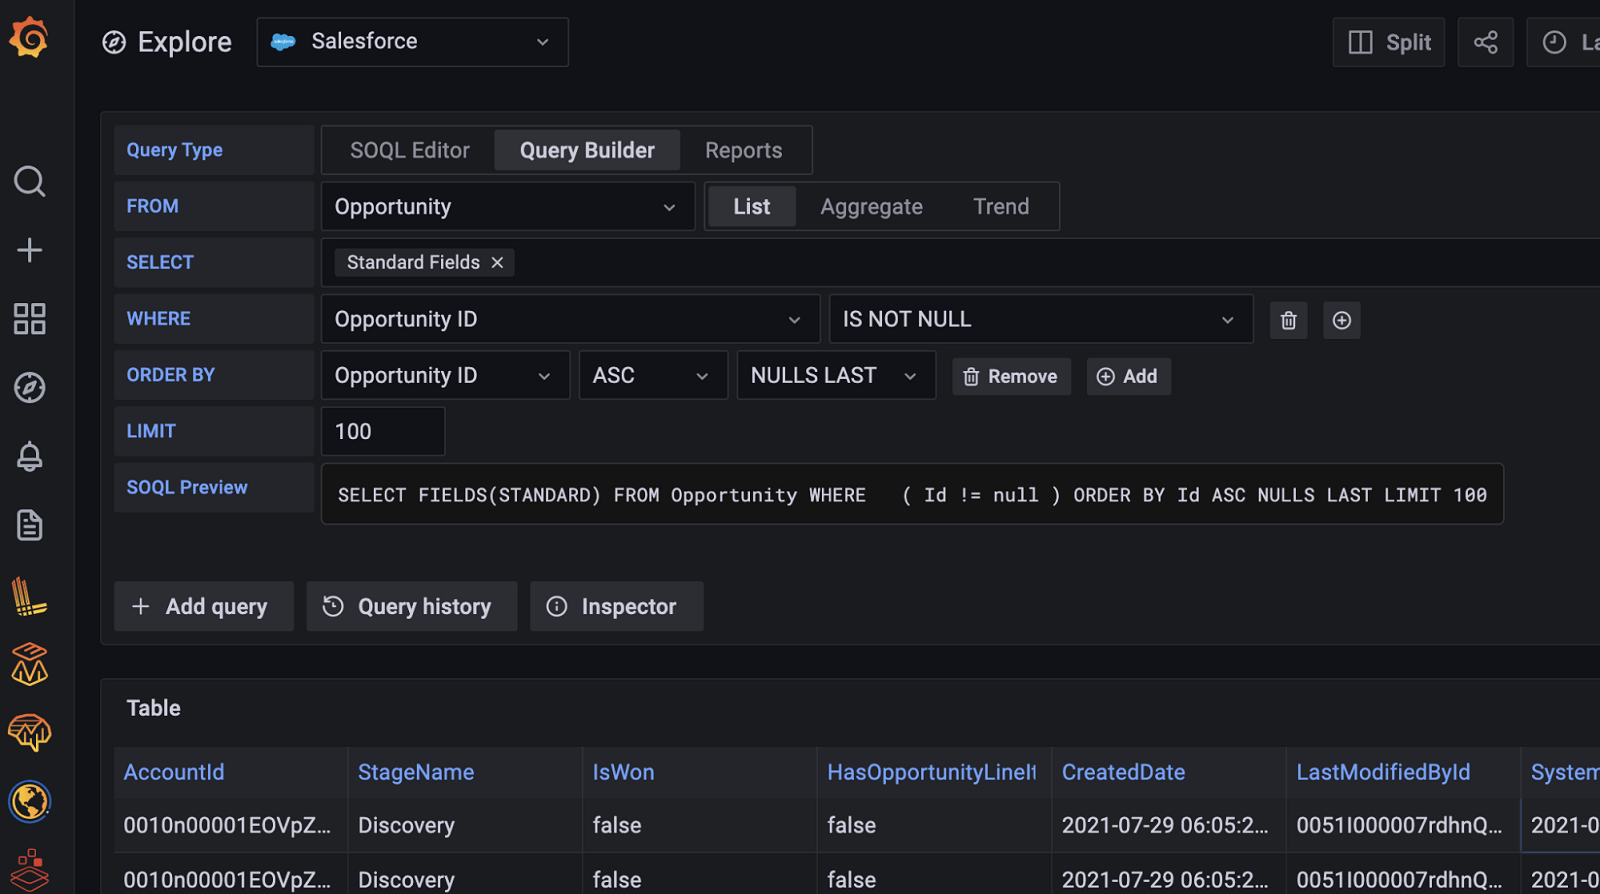
Next to the SOQL button is the Query Builder button.
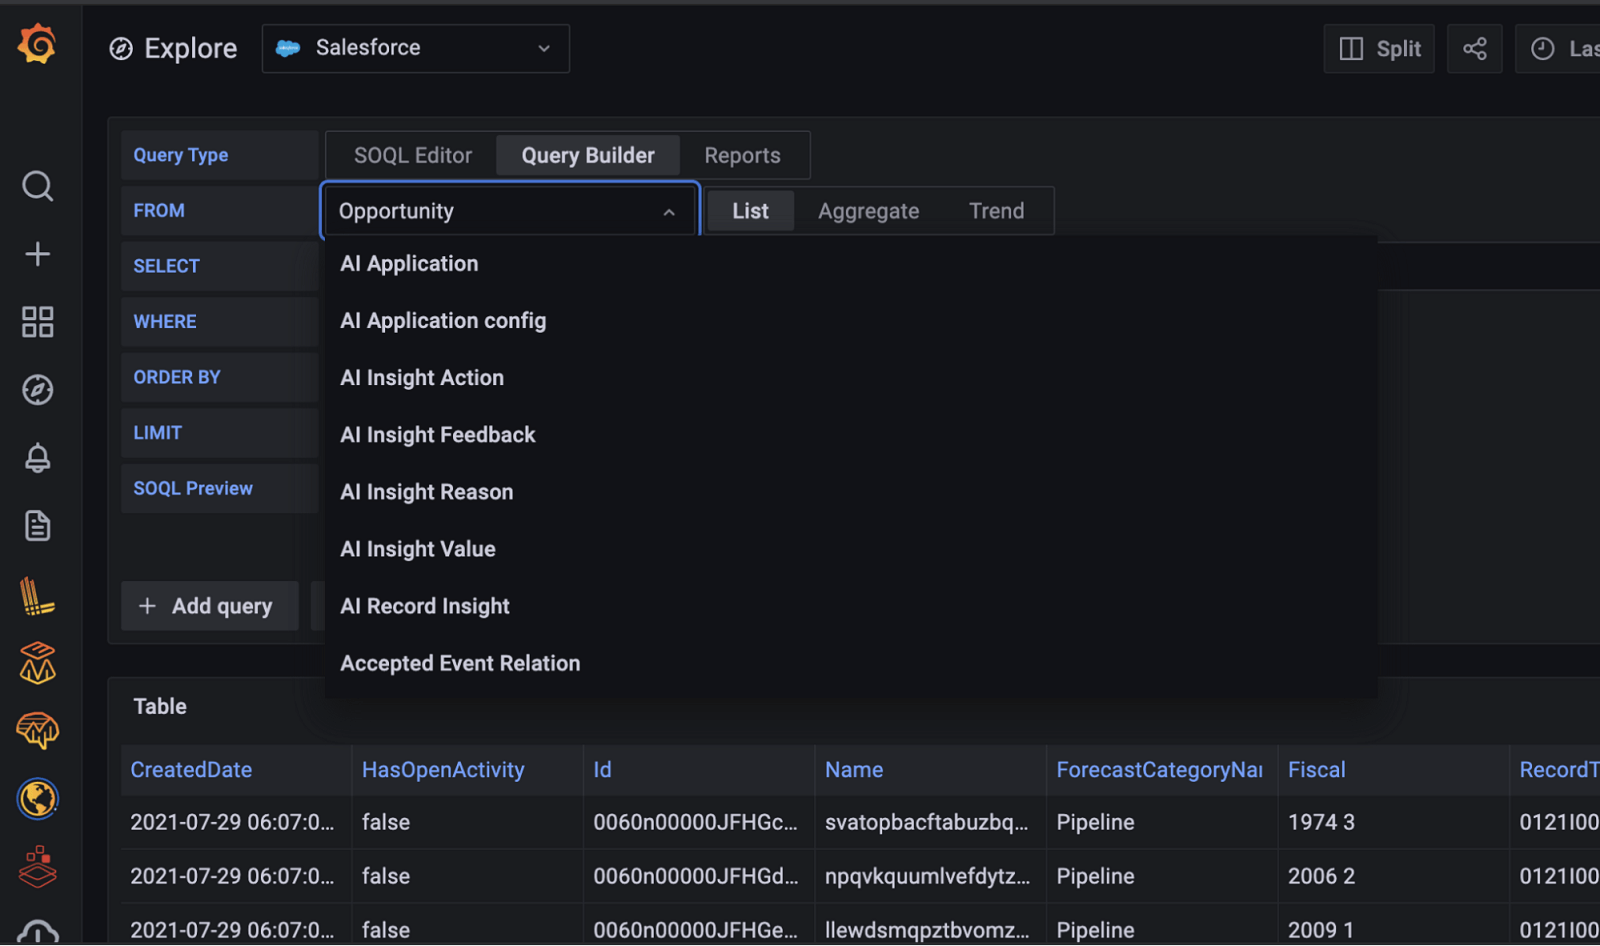
For each part of the query, a drop-down is provided to give you the list of available items for that element. This means that if you don’t know SOQL, you can still build useful queries from Grafana.
Reports
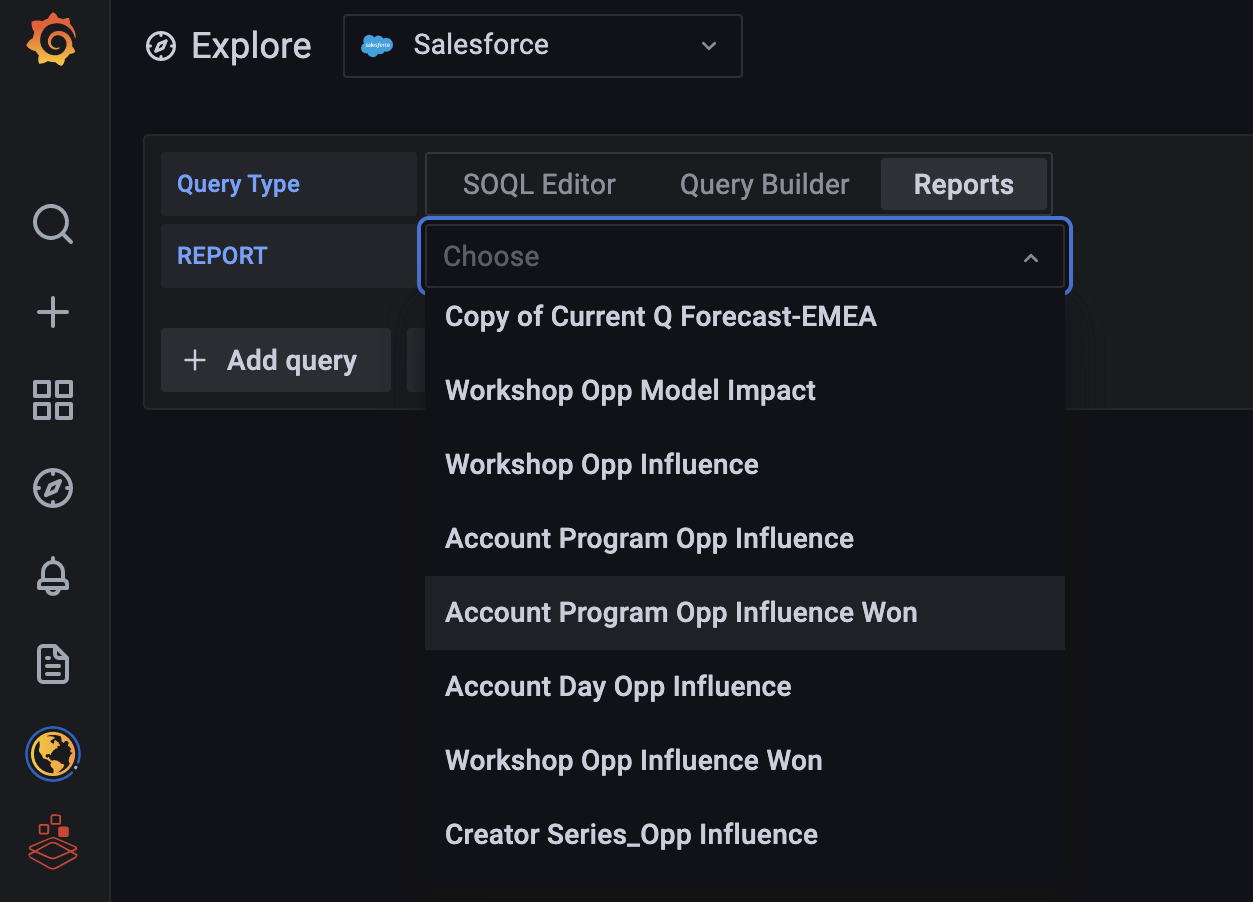
Finally, if you have existing reports that you simply want to view in Grafana, you can choose Reports as the query type. A drop-down list of available reports will be displayed.
Showing Salesforce data in Grafana
Now that you have hooked everything up and have refined your queries, you can add Salesforce data to dashboards and panels with data from other data sources. By choosing the data source type Mixed in a panel, you can add data from multiple data sources.
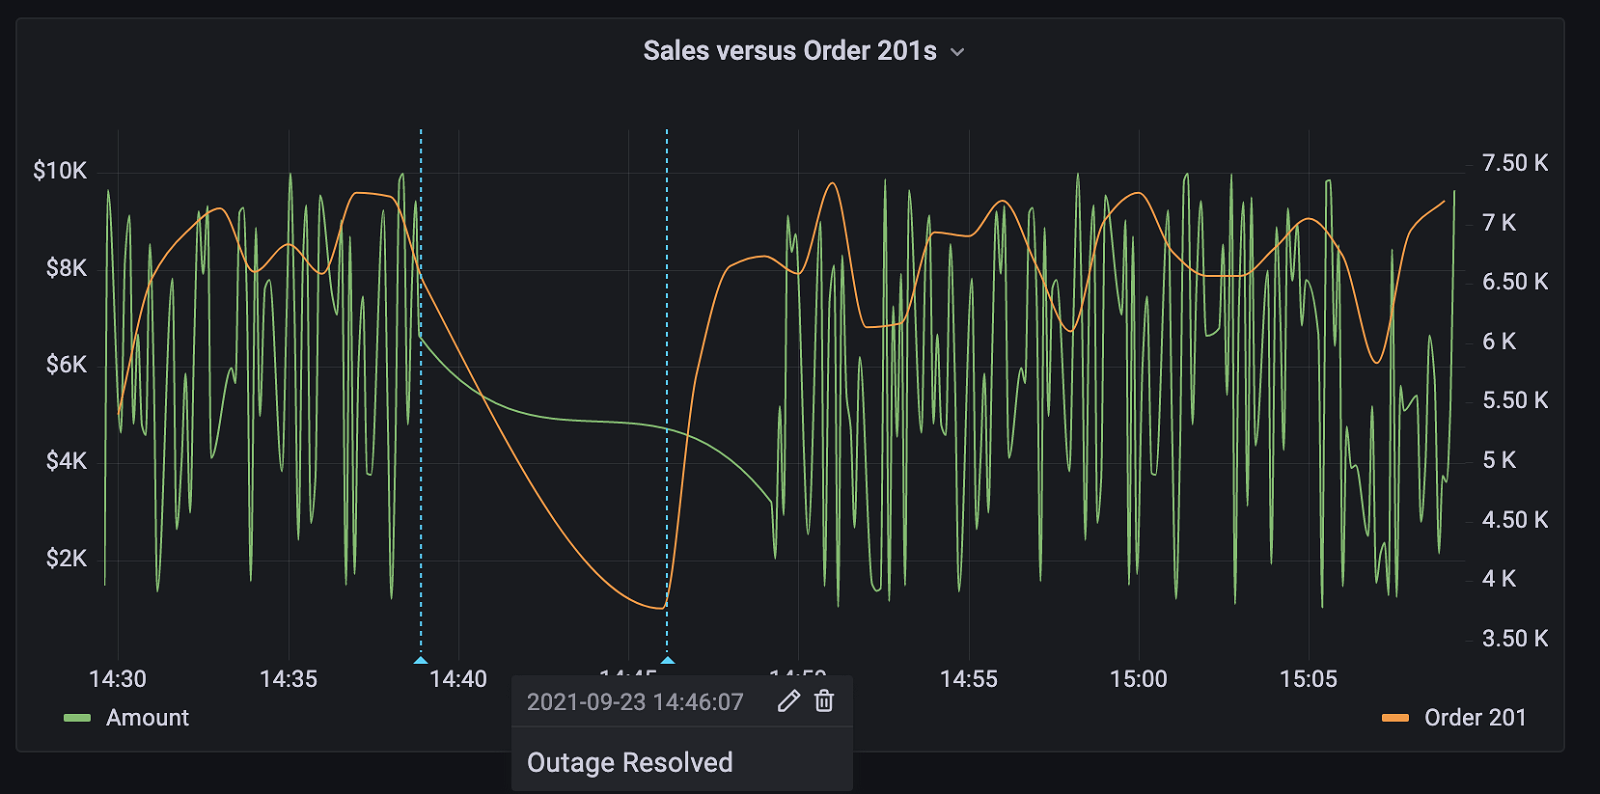
In an example application, the ordering function is provided by a microservice called “orders.” For this microservice, the function generates Prometheus metrics for orders with 201 status codes (order was successfully posted). Each time an order is posted, a new Opportunity marked as “Won” is created in Salesforce. If the orders microservice is down, sales cannot be created. In the panel below, we can see that there was a sudden drop in both the successful orders and the order revenue. Once the outage was resolved, we can see the successful orders starting to flow through the system again, and eventually orders going into Salesforce.
To build out this panel, we would choose a Mixed data source:
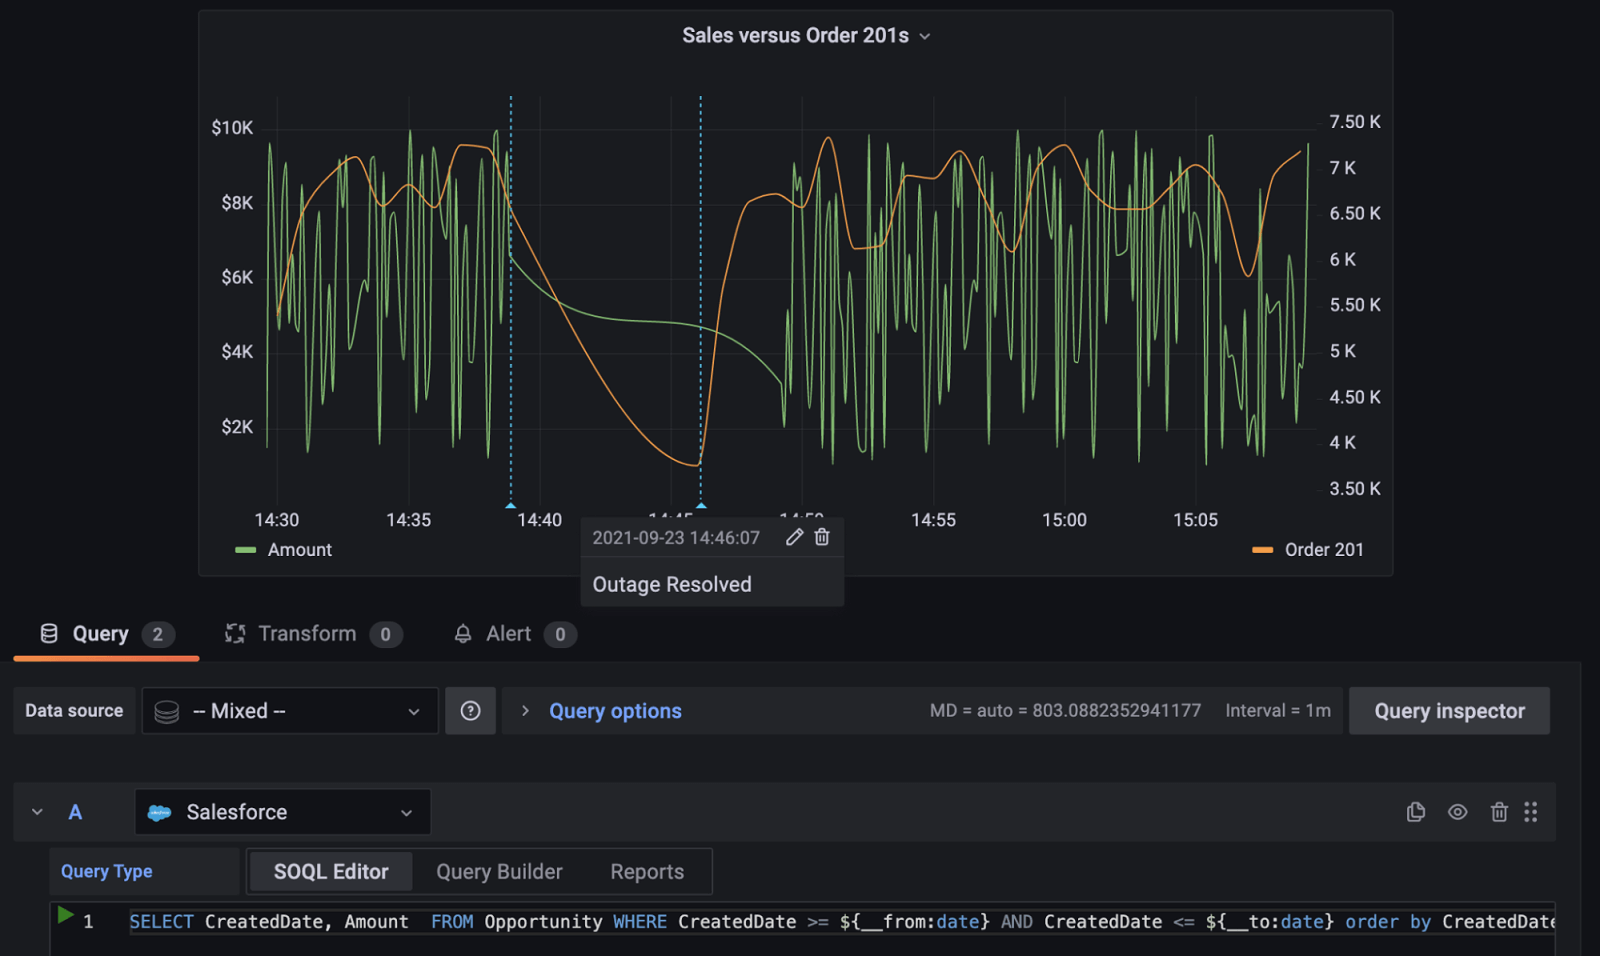
For the first query, we will use the Salesforce data source and SOQL to get the Amount and CreatedDate from the Opportunity object.
The second query will come from Prometheus, where the metrics about our application are being held. In this query, we are doing a rate query on the counter of order successes, counter_status_201_orders, specifically in the development namespace.

This gives you a view, in a single chart, of how your system outage is impacting the revenue of the company.
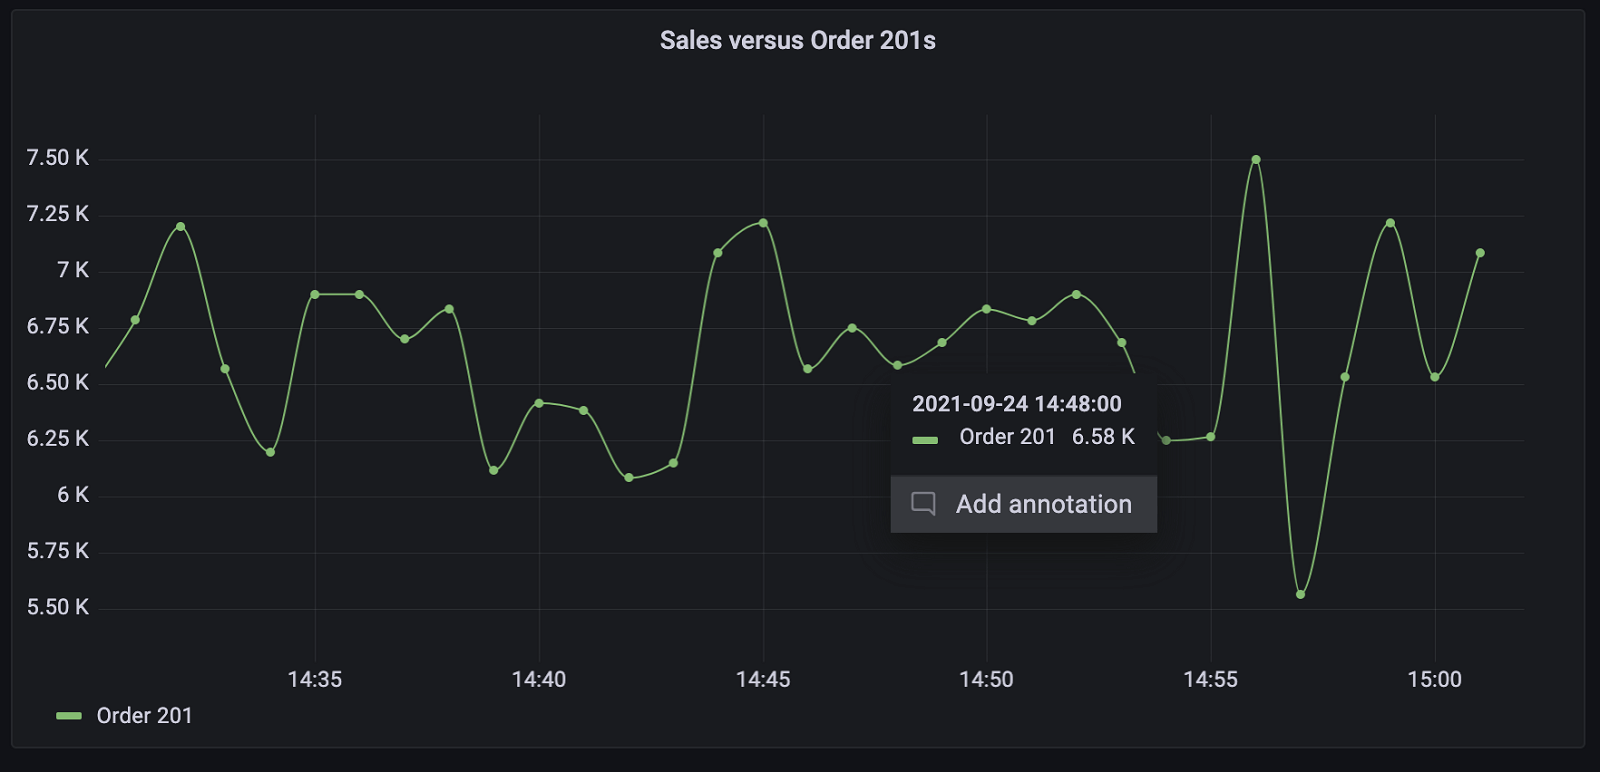
Annotations can make this information even richer. To add an annotation to a chart, simply click on the chart at the time you want to document an external event, and a box will pop up. Click on Add annotation:
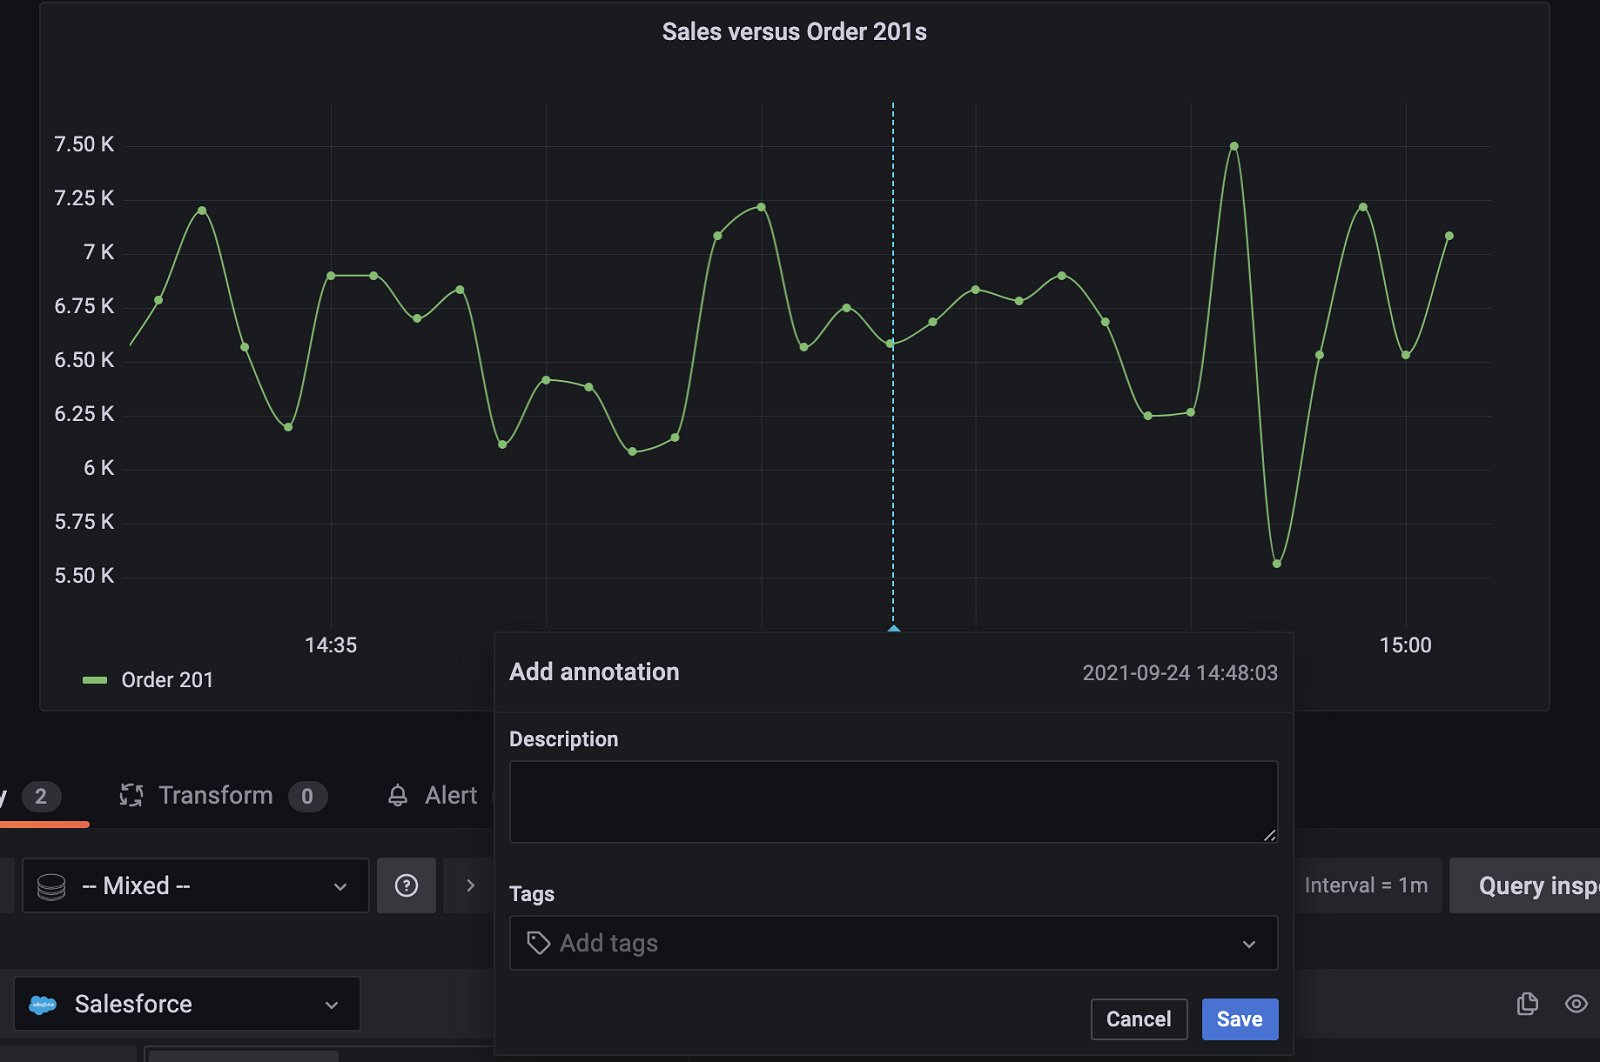
From there you can type in a description and labels:
Try it out now!
You can find out more by referring to the Salesforce solutions page and watching our “Unify your data with Grafana plugins: Splunk, MongoDB, Datadog, and more” webinar on demand.
The Salesforce plugin for Grafana is now available for users with a Grafana Cloud account or a Grafana Enterprise license. Please contact us to get started!
If you’re not already using Grafana Cloud — the easiest way to get started with observability — sign up now for a free 14-day trial of Grafana Cloud Pro, with unlimited metrics, logs, traces, and users, long-term retention, and access to one Enterprise plugin.


