How Sitech builds modern industrial IoT monitoring solutions on Grafana Cloud
Chemelot is an industrial park in the Netherlands with more than 150 companies in chemical and process industries that are working to build the most sustainable and competitive chemical site in Western Europe.
Sitech Services is part of making that happen. The Dutch technology firm brings together maintenance and engineering specialists with data scientists to create multidisciplinary solutions that achieve optimal safety, efficient infrastructure, and efficient processes for the plants.
Within the firm, the Sitech Asset Health Center develops communication strategies and applications for the Sitech customers. “We bring all the information together to make sure that the message that we create by analyzing this data is understood, used, and appreciated,” says Rowen Forman, Data and Business Analyst for the Asset Health Center at Sitech.
And there’s only one tool that his team uses to unify all of their information for clients: Grafana.
Old tech, new solutions
Sitech customers tend to have the same challenge: The equipment within the industry is designed for long-term durability, which often means the technology and processes for the machinery become dated over time.
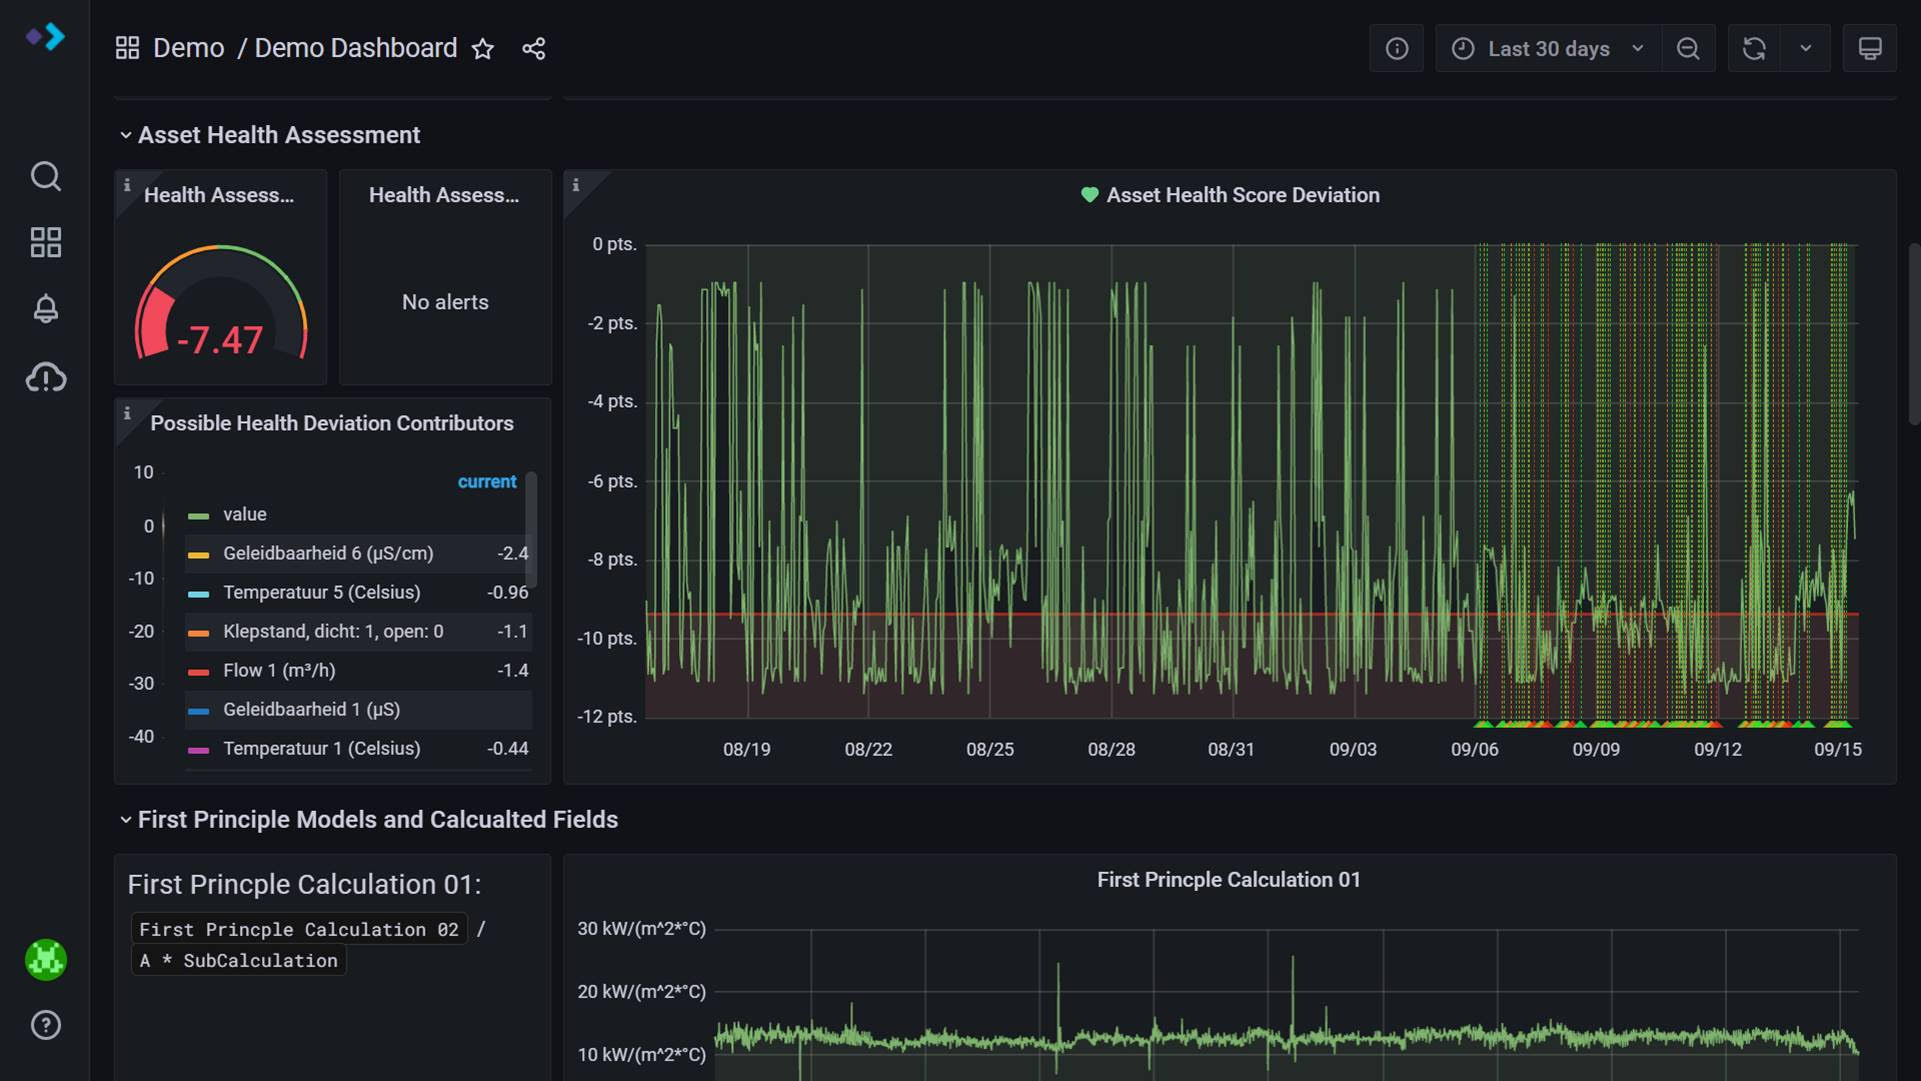
Sitech assesses each plant to identify what equipment is critical and then applies preventive, predictive, and prescriptive maintenance to manage the risk of failure. In Sitech’s analysis reports, Grafana dashboards are used to help customers better understand the health of their assets.

“I talk to the customer about what we can do to help them monitor and make the right decision,” says Bosmans, “and Grafana is an important tool in providing information to really make the right decision.”
“Grafana kept meeting the requirements”
“We used to have a solution that was managed by us,” says Forman. “As it aged, the question came up more and more about how we can find ways to improve user experience.”
Forman’s answer started with the OSS version of Grafana. “We had to test and validate if Grafana was user-friendly and ensure that it met a long list of prerequisites such as including context, customizing data, and supporting user access control. Grafana kept meeting all the requirements along the way.”
Soon the Sitech Asset Health Center upgraded to Grafana Cloud. “We’re a small and lean team. We need to focus on what we’re good at, and we need other specialists to help us where they can,” says Forman. “That’s what Grafana Cloud does for us. We don’t have to worry about hosting or support.”
Sitech then adopted Grafana Enterprise for the single sign-on and team sync functionalities. And the team generates information in the form of annotations to track the behavior and health of equipment.
The Sitech team has also embraced new features in Grafana 8.0 such as state timeline which, along with the community plugin flowcharting, helps the team monitor safety barriers in nodes that evaluate upwards to top nodes.
Customization, control, and remote connectivity
The benefits of Grafana were immediate.
For industrial IoT, Grafana introduced the ability for a single engineer to proactively monitor hundreds of assets remotely. Grafana also enables data to be highly customizable with fine-grain control within each dashboard. Finally, while the data itself is vast and all-encompassing, Grafana unifies the information into one centralized source.
“The opportunity that we now have, with help of Grafana, is the ability to start looking at very critical factors like user experience, scalability, and how it all comes together,” says Forman. “We’re looking to improve and create a new integrated solution.”
To find out more about Sitech’s Grafana Cloud-based solution, check out their full success story here.
The easiest way to get started with Grafana, Prometheus, Loki for logging, and Tempo for tracing is Grafana Cloud, and we’ve recently added a new free plan and upgraded our paid plans. If you’re not already using Grafana Cloud, sign up today for free and see which plan meets your use case.


