How we use Grafana and Prometheus to monitor the traffic of our many GitHub repositories
If you want to understand the popularity of your GitHub repositories, knowing the number of stars isn’t enough. GitHub understands this, and that’s why the team released traffic insights.
Anyone with push access to a repository can view these insights, which include: full clones, visitors from the past 14 days, referring sites, and popular content in the traffic graph. Seeing the data is as easy as going to the main page of your repo, clicking Insights (under the repository name), and then clicking Traffic (in the left sidebar).
Voila! You should see something like this:

Fancy.
But what if you have lots of repos?
At k6, we have tons of open source repositories for integrations, extensions, examples, and docs. And the number continues to rise.
We would love to have a way to understand the popularity and usage of our repositories, without having to collect these stats manually, go over all of them one by one, and take notes.
Introducing the GitHub Traffic tool
We designed and built the GitHub Traffic tool, which programmatically goes over all our repositories, gets the traffic data, and exposes that data as Prometheus metrics. For this tool to get all the repositories for our organization, and all the traffic data that we needed, we used the REST APIs provided by GitHub.
The cool thing about this approach is that we can treat this tool like any other service. We can rely on our current fleet of Grafana Agents to scrape these metrics and ship them to our Grafana Cloud Prometheus instance.
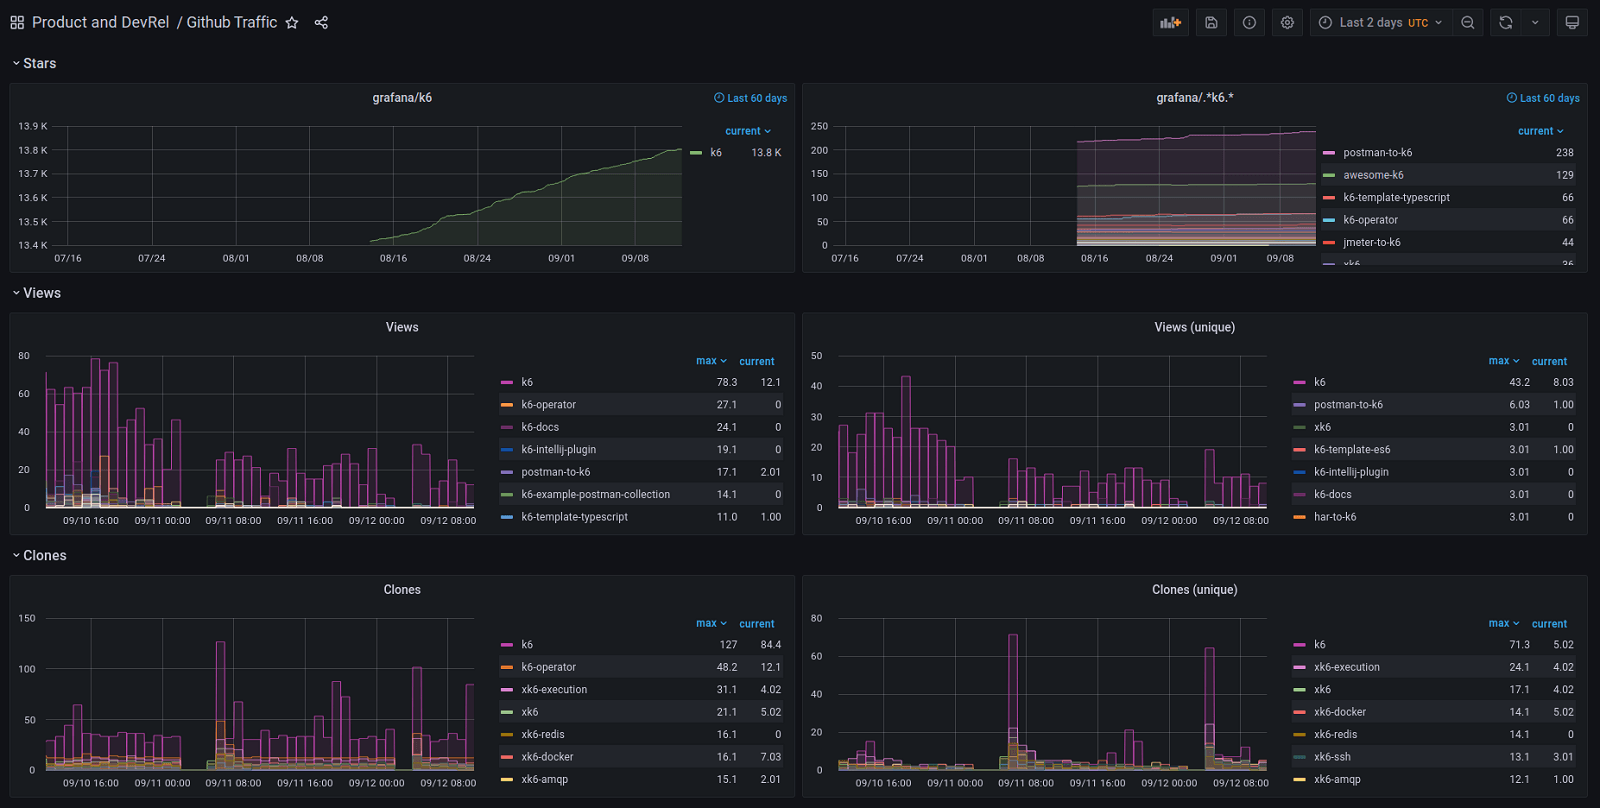
But having all these metrics wasn’t enough. We needed a way to visualize them! So we created a small dashboard that gets the job done:

Cool, cool, cool, but… On that dashboard, you have Views, Clones, and Stars… Where is the list of top referring sites? And the most popular content for each repo?
Good catch! :)
For the first version, we tried to keep the scope small and get only a subset of the available data. In future iterations, we might add that missing data and more fancy stuff.
How you can do it too
Yup. This tool is fully OSS, and it’s available on the grafana/github-traffic repository.
Using it is as easy as creating a small .env file like this one:
$ cat .env
GITHUB_TOKEN=your-github-token-goes-here
ORG_NAME=the-name-of-your-organization-goes-here
And launching a new container:
$ docker run --env-file .env -it -p 8001:8001 ghcr.io/grafana/github-traffic
level=INFO msg="Github traffic is running!"
level=INFO msg="Gather insights" repo="k6" views=163 unique_views=90 clones=406 unique_clones=109 stars=13805
level=INFO msg="Gather insights" repo="postman-to-k6" views=3 unique_views=2 clones=1 unique_clones=1 stars=238
level=INFO msg="Gather insights" repo="jmeter-to-k6" views=1 unique_views=1 clones=2 unique_clones=2 stars=44
...
Once that’s done, you should be able to get a taste of the exposed metrics by going to http://localhost:8001/metrics.
On the repository, you can find more docs about the supported configuration options. We’ve also published a Grafana dashboard that can be used as a starting point to visualize all these new Prometheus metrics.
Let us know what you think
Stay tuned for future content on how to tightly integrate Grafana and GitHub. And tell us what you’d like to see! A good place to reach us is on the issues of the GitHub Repo, or Grafana’s Community Slack.
Lastly, if you liked this post, I encourage you to take a look at our GitHub plugin for Grafana and read the blog post, “How we use the Grafana GitHub plugin to track outstanding pull requests.”
Grafana Cloud is the easiest way to get started with metrics, logs, traces, and dashboards. We have a generous forever-free tier and plans for every use case. Sign up for free now!


