Introducing the Honeycomb plugin for Grafana
This post has been updated to reflect changes in the availability of the Honeycomb data source plugin for Grafana Cloud users.
Over the years, we’ve heard many versions of the same familiar story: large businesses struggling with observability data living in several different systems. At Grafana Labs, our “big tent” philosophy is based on the belief that our users should determine their own observability strategy and choose their own tools. Grafana allows them to bring together and understand all their data, no matter where it lives.
Recently, there’s been interest in our community in Honeycomb, an observability tool focused on debugging high-cardinality and high-dimensionality data. One of our customers in particular wanted to use Honeycomb Query Data, now accessible with a new API, to monitor application performance in conjunction with other observability tools and Grafana features such as annotations. Since the Honeycomb team was already building its Query Data API, it seemed like a good moment for us to partner with them to build an official plugin for Grafana.
We’re happy to announce that the Honeycomb plugin for Grafana is now available for users with a Grafana Cloud account or with a Grafana Enterprise license. All users must also have a Honeycomb Enterprise account. (The Query Data API, which is what Grafana uses to connect, is a Honeycomb Enterprise feature.)
The data source plugin allows you to query and visualize Honeycomb data and link to Honeycomb queries from within Grafana. You can zero in on problem areas detected in Grafana and jump directly into Honeycomb to further analyze and debug issues by doing things like viewing individual traces or leveraging Honeycomb’s analytical features.
A quick example
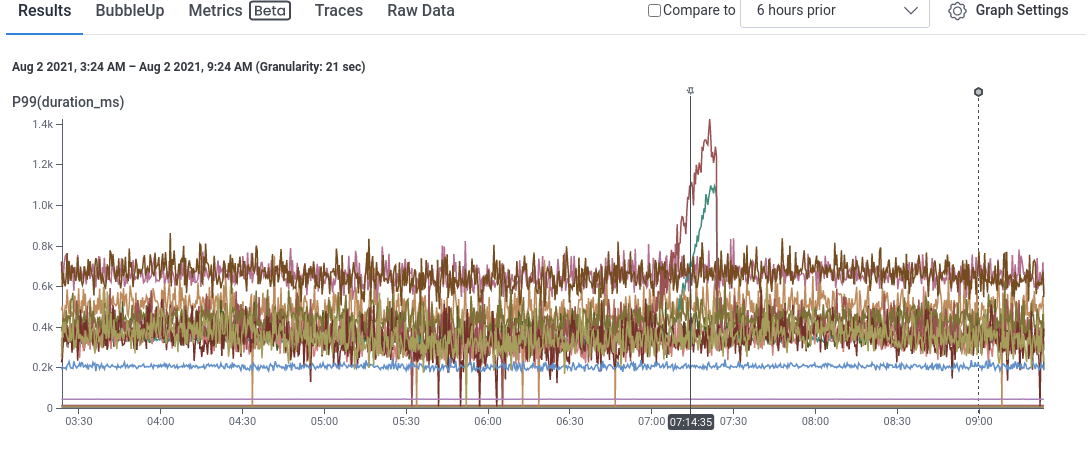
Here’s one example of a common use case for the Honeycomb plugin. Say you have received a Grafana alert for increased latency in your API. You open the panel that reports the 99th percentile of request latencies per endpoint and see that something strange has happened with the /api/v2/tickets/export endpoint.

After finding the spike in the graph, you can click on a data point and select Open in Honeycomb.

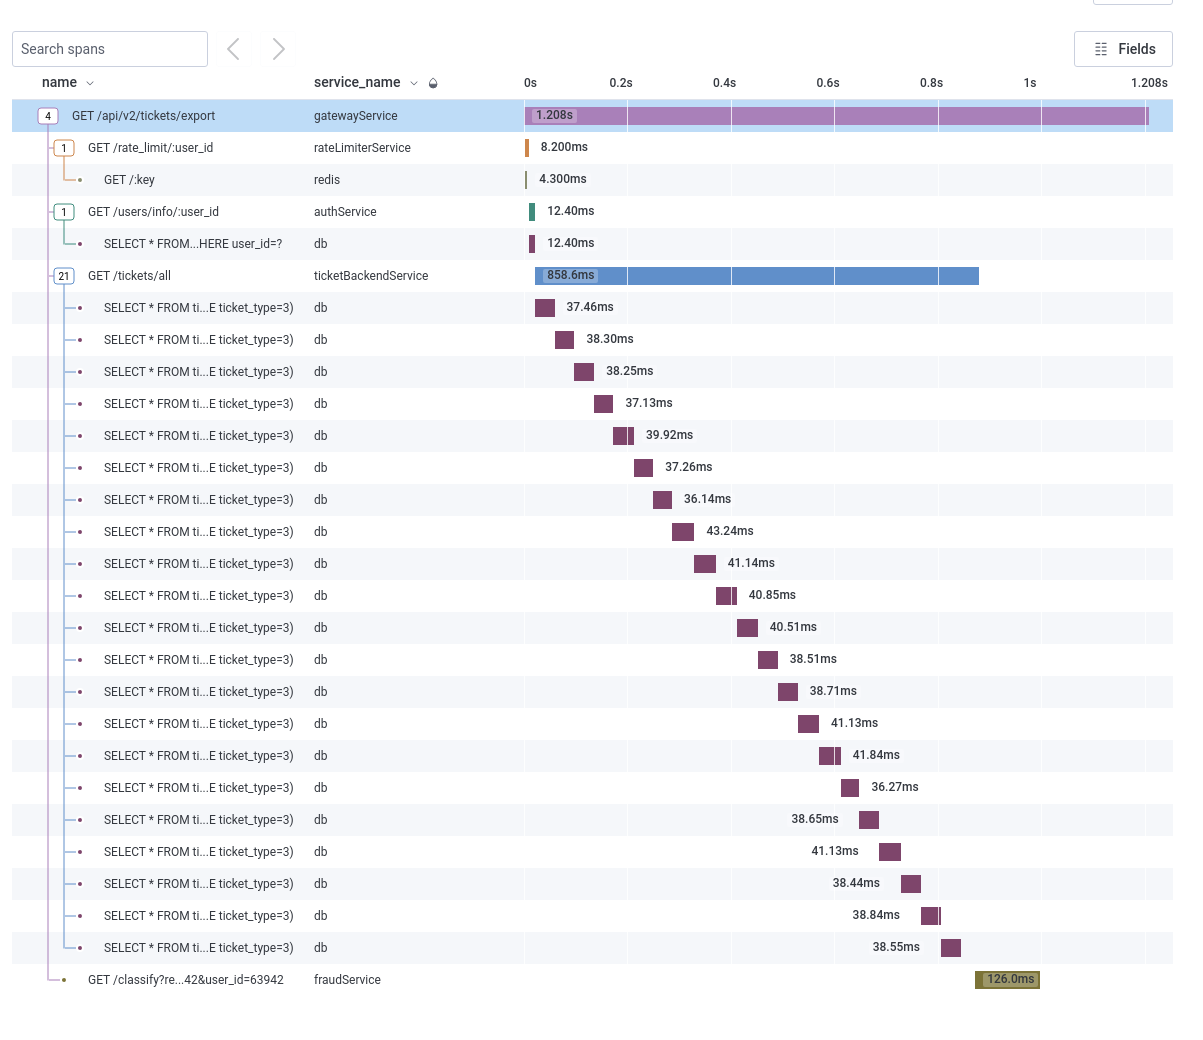
In the Honeycomb view, you can click the traffic spike and see a detailed trace to debug further, or use Honeycomb features like BubbleUp to automatically determine why this set of requests differs from all others.


Learn more
To find out more about the Honeycomb plugin for Grafana, refer to the Honeycomb solutions page or contact our team. You can also watch this demo of how to unify your data with Grafana plugins.
If you’re not already using Grafana Cloud — the easiest way to get started with observability — sign up now for a free 14-day trial of Grafana Cloud Pro, with unlimited metrics, logs, traces, and users, long-term retention, and access to one Enterprise plugin.


