How an observability consulting company solved a client's monitoring issues with Grafana Cloud
Companies are always looking for transparency and visibility when it comes to monitoring, but as monitoring requirements and methods evolve, it’s not always easy to keep up.
That’s why Opsdis, an observability consulting company based in Göteborg, Sweden, was founded. The firm focuses solely on helping clients implement systems for monitoring and metrics so they can keep up with the ever-expanding world of cloud computing and containerized environments.
Opsdis is part of Grafana Labs’ partnerships program, which offers specialized support and growth opportunities for service providers who build Grafana-based solutions to meet their customers’ observability, monitoring, and data visualization goals. “The tool stack that Grafana Labs is promoting is really key for us,” Opsdis’ CTO Anders Håål says. “It makes so much sense, especially now with the introduction of Loki, and the combination of advanced logs and metrics.”
A weighty issue
Last year, Opsdis worked with Cind AB, a Swedish company that uses innovative 3-D camera technology to measure the weight and volume of objects, such as bulk packages on a conveyor belt or the size of a lumber load on a truck.
At the time, Cind only had manual monitoring processes. If there was a problem at a site (such as a lumberyard or a warehouse), a customer would have to call the support team, which would then remotely connect to the site and try to manually grep through each and every log file and see if all the processes were running.
Opsdis developed an easily-scalable monitoring system for Cind using Prometheus, Loki, and Grafana, along with the fully managed Grafana Cloud offering. Now Cind is able to monitor the health and state of key system processes and onsite cameras, as well as gather logs from the entire system. It’s been implemented locally at each customer site — there are more than 50 — and provides visibility across those sites.
Seeing success
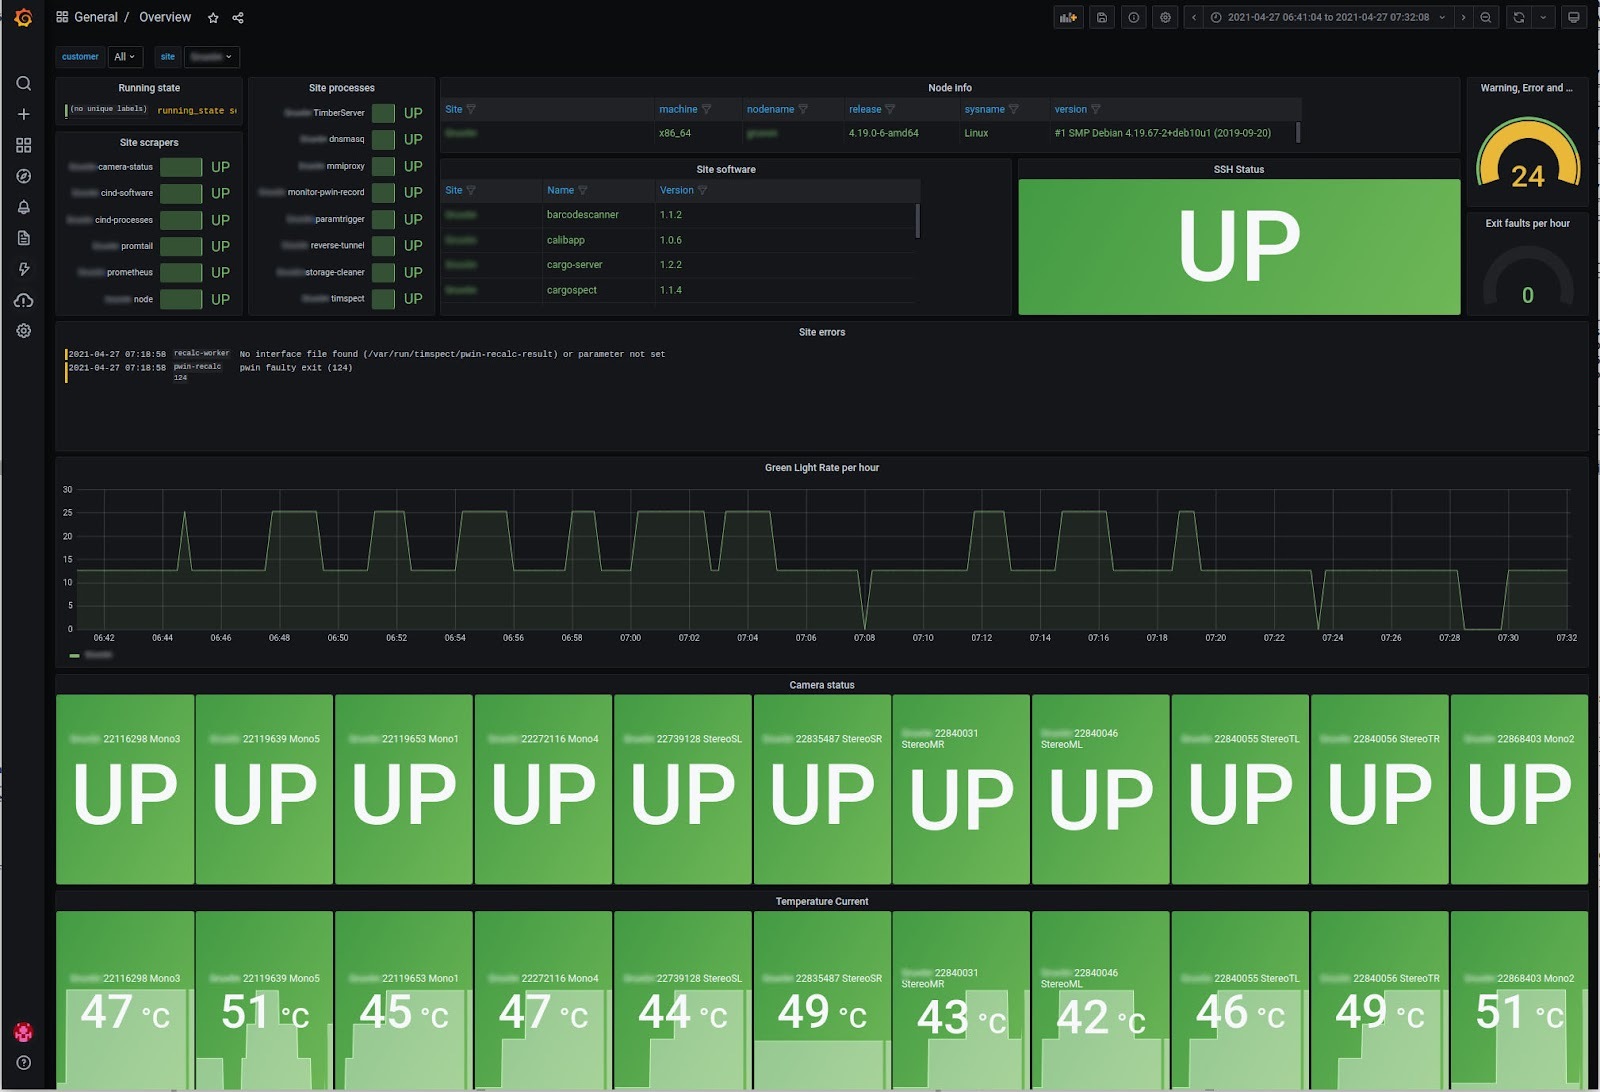
Cind’s operations team uses a few templated dashboards in Grafana. There’s an overview map where the company can see the statuses of all of its customers, and a narrower view that displays sites belonging to one customer. The Cind support team can also look at site-specific dashboards (example below), which are designed the same for all locations. The panels include temperature data, camera statuses, the state of site processes, and other key information.

“What they got is a central view of all their customers that they didn’t have before,” Håål says. Not only can Cind reach the logs and calculate metrics on the fly, but the new monitoring system has also given the company a way to manage its data and use the information in meaningful ways, such as using Loki for log discovery and forensics.
Since they’re also able to look at historical trends, they can understand how their equipment has changed or moved over time. The team can even solve issues before a customer realizes there’s a problem.
Håål says Cind’s new monitoring system left its team intrigued about what it can do next. “This aspect of observability has become part of their own development process.”
To find out more about Opsdis’ Grafana-based monitoring solution for Cind, check out their full success story here.
The easiest way to get started with Grafana, Prometheus, Loki for logging, and Tempo for tracing is Grafana Cloud, and we’ve recently added a new free plan and upgraded our paid plans. If you’re not already using Grafana Cloud, sign up today for free and see which plan meets your use case.


