How we fixed a double-counting Prometheus bug while working on a Grafana Cloud project
In my role as a software engineer at Grafana Labs, I recently worked on a project that involved generating PromQL queries. One of the ways we verified the correctness of the generated queries was with a suite of integration tests. These tests would execute the generated PromQL queries against a local instance of the Prometheus query engine with some test data, and verify the results were as expected.
The integration tests were immensely useful, helping us find issues in our PromQL query generator, and, in one case, a bug in Prometheus. In this blog post, I’ll be talking about how we found that bug, what caused it, and the fix.
Seeing double
After adding a feature to the PromQL query generator, I decided to be a responsible software engineer and add integration tests to verify the new behavior.
Or, at least, I tried to.
For some reason, one of the new tests I’d written wouldn’t pass. The query generator was outputting the expected PromQL query. However, it seemed like there was a problem with Prometheus itself: When evaluating the generated query, incorrect results were being returned.
The test was doing something like the following:
- Creating a time series named foo with the sample values [5, 10, 15, 20, 25] at 30-second intervals.
- Running the PromQL query
sum_over_time(foo[30s])with a step of 60 seconds (i.e., every 60 seconds, sum up the sample values in the last 30 seconds).
Therefore we expected the result to be:
- 5 at 0s (single sample at 0s with value 1)
- 25 at 60s (sample at 30s with value 10, plus sample at 60s with value 15)
- 45 at 120s (sample at 90s with value 20 plus sample at 120s with value 25)
However, the actual result at 60s was 35 instead of 25.

Trying different sample values in the failing test, I started to notice a pattern.
For example, with the sample values [0, 1, 10, 100, 1000] loaded at 30-second intervals and the same query and step as the previous example, the result at 60 seconds was 12 instead of 11.

The second sample in the series was being double-counted. For this example, the sample at 30s (with value 1) was double-counted, leading to the result at 60s being 1+1+10=12 instead of 1+10=11.
Going back to the initial example, the sample at 30s (with value 10) was double-counted, leading to the result at 60s being 10+10+15=35 instead of 10+15=25.
Seeking answers
Now that I had a rough idea of the problem, it was time to take a closer look at what was happening during query evaluation. Armed with reproducible failing test cases, a debugger, and relevant background music, I dove into the Prometheus codebase.
To calculate sum_over_time() for a series, the Prometheus query engine first needs to extract the raw samples in the relevant time range. It does this by using an iterator that can traverse samples for a series in timestamp-increasing order. Two iterator methods used by the query engine are: Seek(), which advances the iterator to the first sample that’s equal to or greater than a specified timestamp, and Next(), which just moves to the next sample.
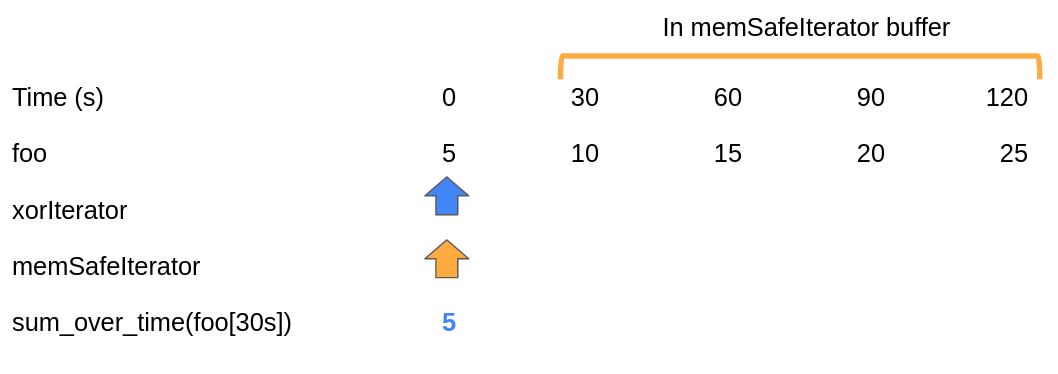
There are multiple iterator implementations. The memSafeIterator is used to query the samples that are in memory. It consists of: 1) an internal iterator that reads samples that have been stored in a compressed format (xorIterator), and 2) a buffer that stores the last four samples in an uncompressed format. If any of the last four samples are required, memSafeIterator reads from its buffer. Otherwise, it just returns the results from its internal iterator.
In our failing test, memSafeIterator was getting out of sync with its internal iterator. While calling Next(), both iterators would advance by one sample. However, when calling Seek(), only the internal iterator would update its current sample. This meant the memSafeIterator was not reading from the buffer correctly.
To make the explanation clearer, let’s go through a (simplified) walkthrough of how the iterator bug caused the integration test to fail.
At the start, both the internal xorIterator and memSafeIterator are pointing at the initial sample at 0s. To evaluate the sum_over_time() query at 0s, the sample value at 0s is read. Since that sample is not in the buffer, the result of the internal iterator is used (i.e., 5).

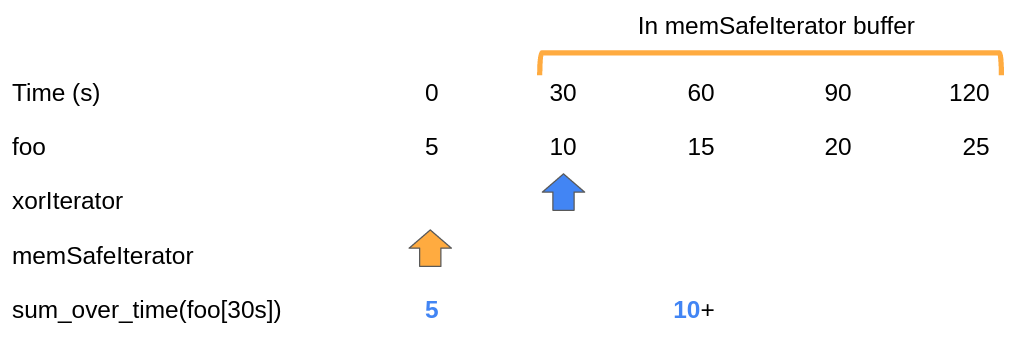
Then the query is evaluated at 60s. This means that all the sample values from 30s to 60s are summed. The Seek() method is called to move to the earliest sample in that time range (in this case the sample at 30s). With the bug, only the internal iterator updates its current sample to the one at 30s. memSafeIterator remains at the 0s sample.
memSafeIterator does not think it has reached its buffer, so when reading the current sample, it uses the result from the internal iterator instead. The internal iterator returns 10 as the first value in the time range.

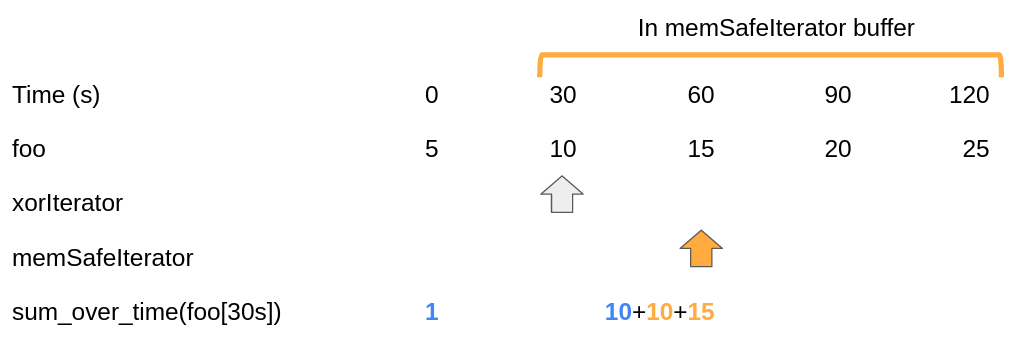
As the end of the time range hasn’t been reached, Next() is called to get the following sample. This causes memSafeIterator to advance to the sample at 30s. It detects that it has reached the buffer, and therefore stops reading from the internal iterator. Instead, the 30s sample value is read again, but this time from the buffer.

Next() is called again, advancing the memSafeIterator to the last sample in the current time range, the 60s sample, which has a value of 15.

Summing up the collected sample values (10+10+15), we get the incorrect answer of 35.
The fix
memSafeIterator is a Go struct. Its internal iterator is an embedded field. This means if a method isn’t defined for memSafeIterator but is for the internal iterator, the internal iterator’s method will be called.
In this case, memSafeIterator did not have a Seek() method, though its internal iterator did, so calling memSafeIterator.Seek() was only causing the internal iterator to execute its Seek() method and advance its current sample.
To finish off the investigation, I added a Seek() method to memSafeIterator that updated its current sample correctly, submitted the fix to Prometheus, and finally, checked our integration tests were now succeeding.
Interesting links
- Prometheus PR for the bug fix
- memSafeIterator code in Prometheus
- Initial commit for memSafeIterator, explaining its use case
- xorIterator code in Prometheus
- Prometheus query engine test code that our internal integration tests are based on
Conclusion
Since I joined Grafana Labs nine months ago, I’ve worked on metric ingestion and query translation, learned about several monitoring systems, and started making open source contributions. The double-counting Prometheus bug is just one example of an interesting problem I’ve encountered. If this work sounds interesting to you, we are hiring!


