Grafana meetup recap: SLO tips, Agrology’s IoT monitoring setup, and wide time series format
Last week at Grafana Labs, we launched our new Grafana Meetup Program with our East Coast Virtual Meetup. It was a ton of fun bringing together the community for this first event in our meetup series, but the road to getting here has been quite a journey!
As a community-driven company, going more than a year without any in-person events has been pretty rough on all of us Grafanistas. When I joined Grafana Labs last year at the start of the COVID-19 pandemic, there were already ambitious plans under way to launch a global meetup program. However, with a lot of pandemic-induced uncertainty, we needed to put the initial launch on hold while we figured out what the future of our event programming would look like.
After hosting Grafana ObservabilityCON in October 2020 and our second GrafanaCONline this past June as online-only events, it became clear that if we wanted to organize any community-based meetups in 2021 outside of our big conferences, we were going to have to do them virtually as well. With the help of my fantastic Grafana Labs teammates and our wonderful community, we were able to get the meetup gears in motion this month with an event for the Eastern U.S. & Canada time zone. And after the success we had there, there’ll be plenty more to come!
Each meetup features “bite-sized” presentations from our user community and members of the Grafana Labs team followed by breakout discussion groups with topics attendees can choose from. After all, the point of a meetup is to meet! We want to provide opportunities (even virtually!) for members of the Grafana community to connect with one another and share what they’re working on or have learned.
If you’re interested in presenting at a future Grafana Meetup, be sure to fill out our guest speaker application with your talk idea!
In case you missed last week’s event, here’s a recap of our August 2021 Grafana East Coast Virtual Meetup along with the session videos.
How Agrology helps farmers fight climate change with Grafana, machine learning, and IoT
Presentation slides are available here.
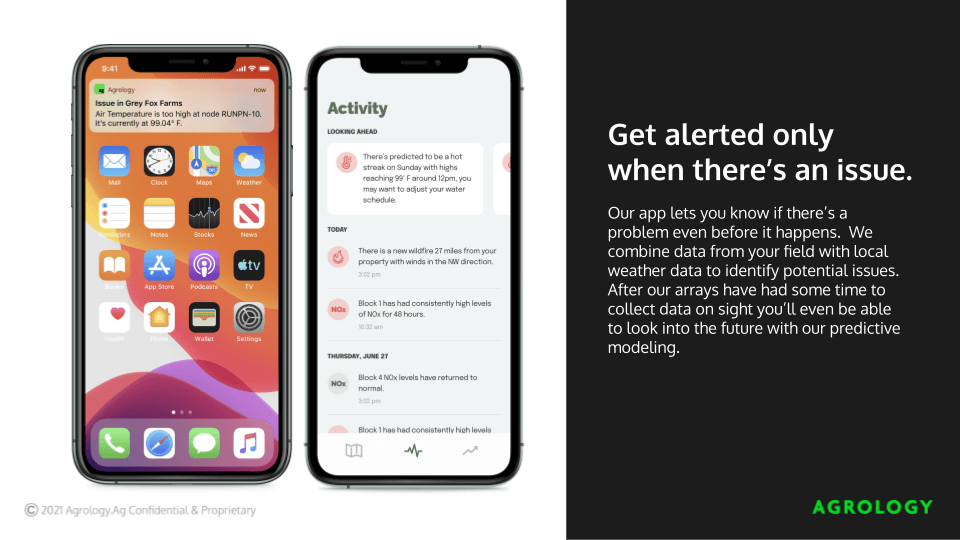
Agrology is a Washington D.C.-based AgTech startup focused on helping farms, vineyards, and orchards stay ahead of climate change and maximize crop yield with their innovative IoT platform of affordable sensors. Emma Sagan, Agrology’s COO, kicked off the evening by giving an overview on how their Grower software subscription service collects data from sensors installed on customer farms and delivers predictive insights via machine learning to determine the right amount of water, fertilizer, pesticides/fungicides, and bio-stimulants for the right area of their farms at the right time. As many farms, particularly those in the western United States, are dealing with the impact of climate change, Emma shared how the Agrology mobile app is currently being used to give their customers timely recommendations on when to adjust their watering schedule during droughts and how the app’s alerts help them stay ahead of the constant threat of wildfires.

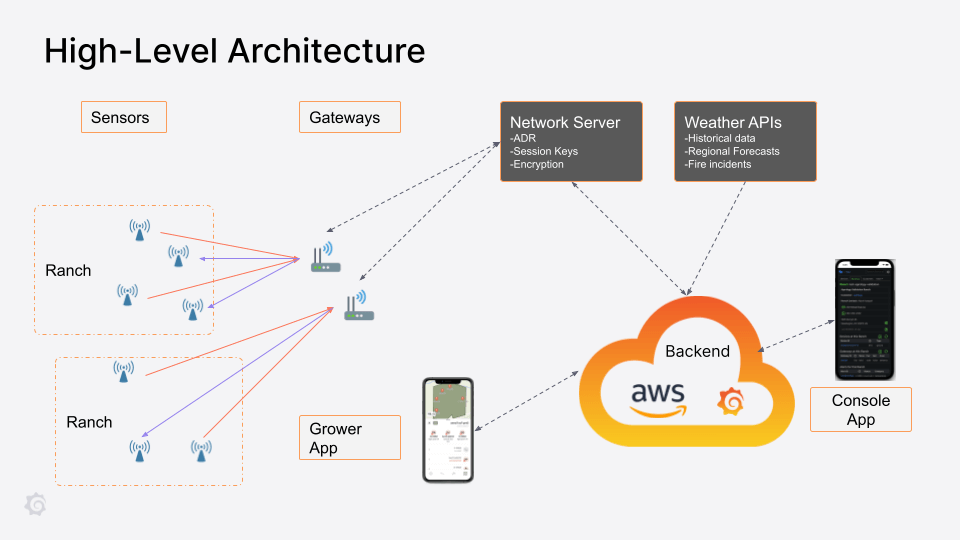
Agrology’s CTO Tyler Locke then offered a deeper dive into the development of Agrology’s network of hardware sensors that powers their platform, which they optimized for affordability, energy efficiency, and the ability to stand up to a wide range of environmental elements. Tyler explained the high-level architecture of their platform and how their sensor network connects to the front-facing customer view of their software application. During the Q&A, Emma and Tyler shared some of the unique challenges their team overcame on the hardware side due to COVID-related chip shortages and the supply chain disruption caused by the Suez Canal blockage.

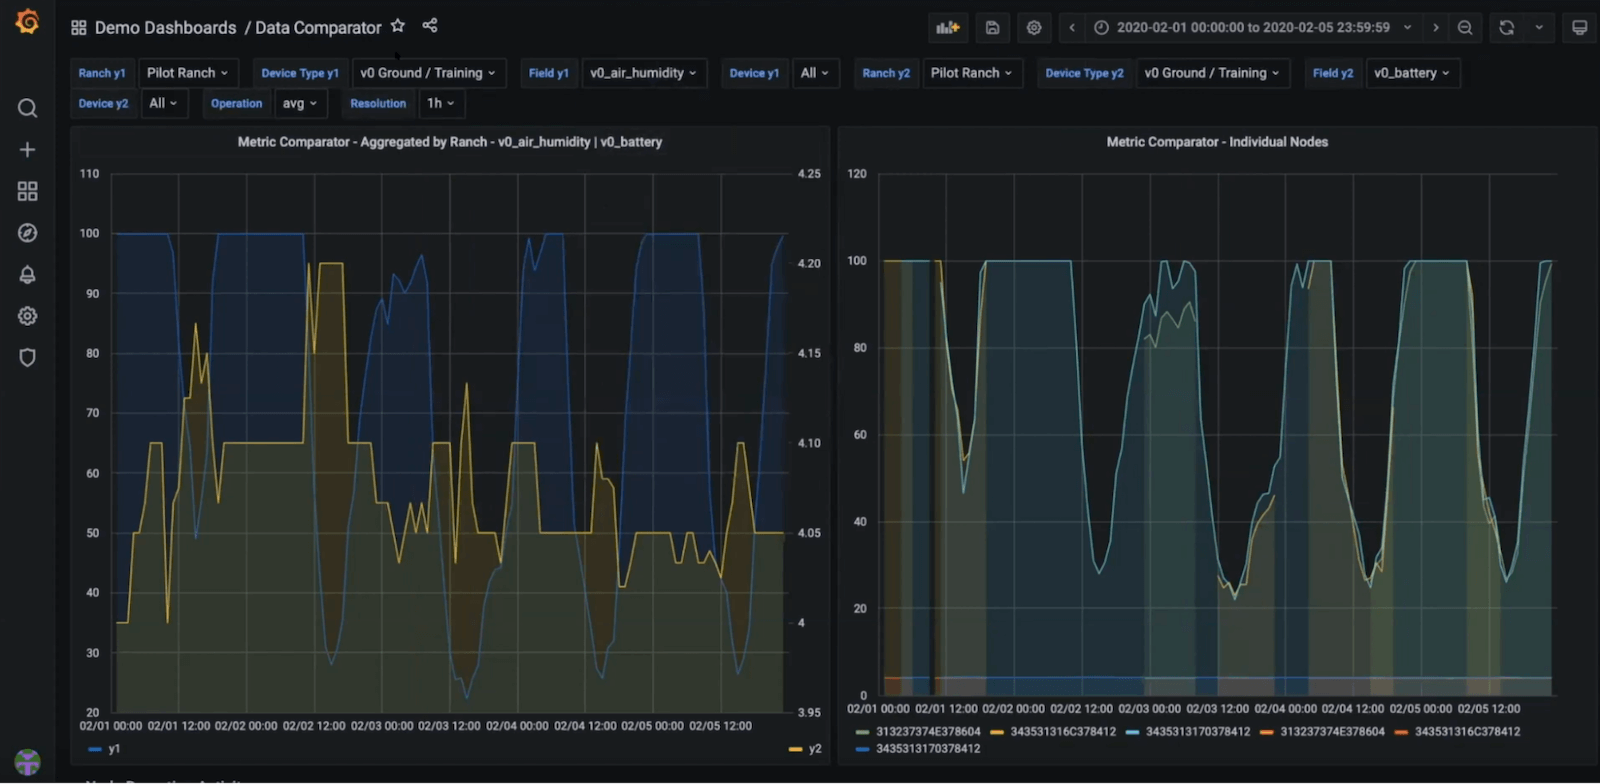
After a tour of the software and hardware components, James Ranson, Founder of the cloud consulting firm Vigra, gave us an in-depth look at the Grafana dashboards he built out for the Agrology team that help monitor the data being collected by their customer site-based Agrology sensors. James noted that since Agrology has a grant via the National Science Foundation (NSF), their Grafana dashboards enable them to send reports for their sensor and training data back to the NSF. One of the highlights from this impressive tour of dashboards was the “Data Comparator,” which uses two graph panels side by side along with Grafana template variables to create dropdown menus that allow the Agrology team to compare sensor data for different metrics (such as air pressure or humidity) across different sensors on the same site or sensors at different site locations.

Aside from monitoring customer sites via the sensor network, Agrology also uses Grafana dashboards to keep tabs on their backend infrastructure via the AWS Cloudwatch data source for their 100% serverless setup on AWS Lambda. James wrapped up by sharing a couple of future Grafana-related projects the team has lined up such as automating their machine learning output into Grafana and migrating away from self-hosted Grafana to a managed service for ease of maintenance.
SLOs, SLIs, and where to find them
After the Agrology presentation, Grafana Labs Senior Cloud Integrations Engineer Jacob Plicque III gave an excellent introduction to the world of Service-Level Objectives (SLOs) and Service-Level Indicators (SLIs). During his talk, Jacob discussed the cultural considerations for implementing incentives across teams responsible for reliability and the importance of communicating trade-offs between this type of work and other engineering efforts. He then dove into how the process of creating SLO targets and error budgets can answer the tough question all customer-facing service level agreements (SLAs) hinge on: “How reliable is reliable enough?” Jacob then gave a demo of how the Grafana Cloud team uses synthetic monitoring to bring in an “outside view” on availability metrics. During Q&A, we chatted about “growing pains” that occur while scaling; the impact they can have on SLIs and SLOs; and when and how they need to evolve as teams and companies grow.
WTF! Migrating to Grafana’s wide time series format
Stephanie Closson, a Software Engineer on the Enterprise team at Grafana Labs, closed out the evening with a short presentation on the wide time series format that was introduced in Grafana v7.5. Grafana supports a variety of different data sources, each with its own data model. Since v7.0, Grafana consolidates query results from each data source into one unified data structure called a data frame to assist with visualizing the data in Grafana panels.
During the session, Stephanie provided an explanation of two current formats used by data frames: multi-frame time series and wide time series. Multi-frame format separates data frames by each individual series while the wide time series format groups data frames by common time stamps. If you’ve been having issues using data transformations with older panel visualizations after updating to newer versions of Grafana, check out Stephanie’s demo in the video above for troubleshooting tips on when to use the wide time series vs. multi-frame options.
We are currently looking into hosting a West Coast Virtual Meetup later this year! To learn more about upcoming meetups, webinars, and demos, check out Grafana Labs’ upcoming events.


