Streaming real-time Telegraf metrics using Grafana Live
A typical IoT application with any physical system or process in the field can have hundreds of on-site sensors generating copious amounts of data every second and possibly communicating in several different protocols.
Most of the time it is very useful to have a short-term, high resolution stream of those sensors’ data to a visualization tool like Grafana, but at the same time scraping and aggregating that data in real time along with the ability to store them to a time series database like InfluxDB is also necessary.
Most of the applications for this use case leverage the Telegraf agent for the scraping and metricising of the sensor data via its ecosystem of input plugins. However, there was no easy way to stream those Telegraf metrics to Grafana until the recent v8.0 release, which introduced the HTTP Push end-point under the Grafana Live feature.
In a previous blog post, we used an IMU-based sensor system communicating over the MQTT protocol to stream real-time sensor data to Grafana Live. Here, we will use the same setup to demonstrate the ease of use of the HTTP Push end-point to stream Telegraf metrics using Grafana Live.
Configuration details
Telegraf is an open source server agent based on a plugin-driven architecture to collect, process, aggregate from, and write metrics to various stacks, sensors, and systems. It has a variety of plugins which can be used to connect multi-protocol sensor systems to databases, cloud services, visualization tools, etc.
Grafana Live is an integrated real-time messaging engine based on a publish-subscribe framework built into Grafana, introduced as part of the v8.0 release. It includes a new HTTP Push API end-point which accepts metrics in Influx format from Telegraf and streams them as Grafana data frames to the UI.
The setup for the IMU sensing board and the MQTT broker for publishing is outlined in the demo featured here. The only difference is how that IMU data is ingested into the Grafana Live engine.
We used the MQTT Consumer Telegraf input plugin to connect to the broker running locally on the Pi. With that we were able to periodically (~20ms) scrape and metricise the messages being published by the IMU sensor on the appropriate topic. Here is a sample configuration that can be used for this:
[[inputs.mqtt_consumer]]
 ## Broker URLs for the MQTT server or cluster.  To connect to multiple
 ## clusters or standalone servers, use a seperate plugin instance.
 ##   example: servers = ["tcp://localhost:1883"]
 ##            servers = ["ssl://localhost:1883"]
 ##            servers = ["ws://localhost:1883"]
 servers = ["tcp://192.168.1.100:1883"]

 ## Topics that will be subscribed to.
 topics = [
   "imu/data",
 ]

 data_format = "json"
Once we had the data within the Telegraf agent, it was super easy to ingest that into Grafana via the HTTP Telegraf output plugin over the Grafana Live HTTP Push API end-point. Here is a sample configuration that can be used to do that:
[[outputs.http]]
 url = "http://localhost:3000/api/live/push/telegraf"
 data_format = "influx"
 [outputs.http.headers]
   Authorization = "Bearer <Your API Key>"
Note: You can obtain the necessary API key from within Grafana by following the instructions here.
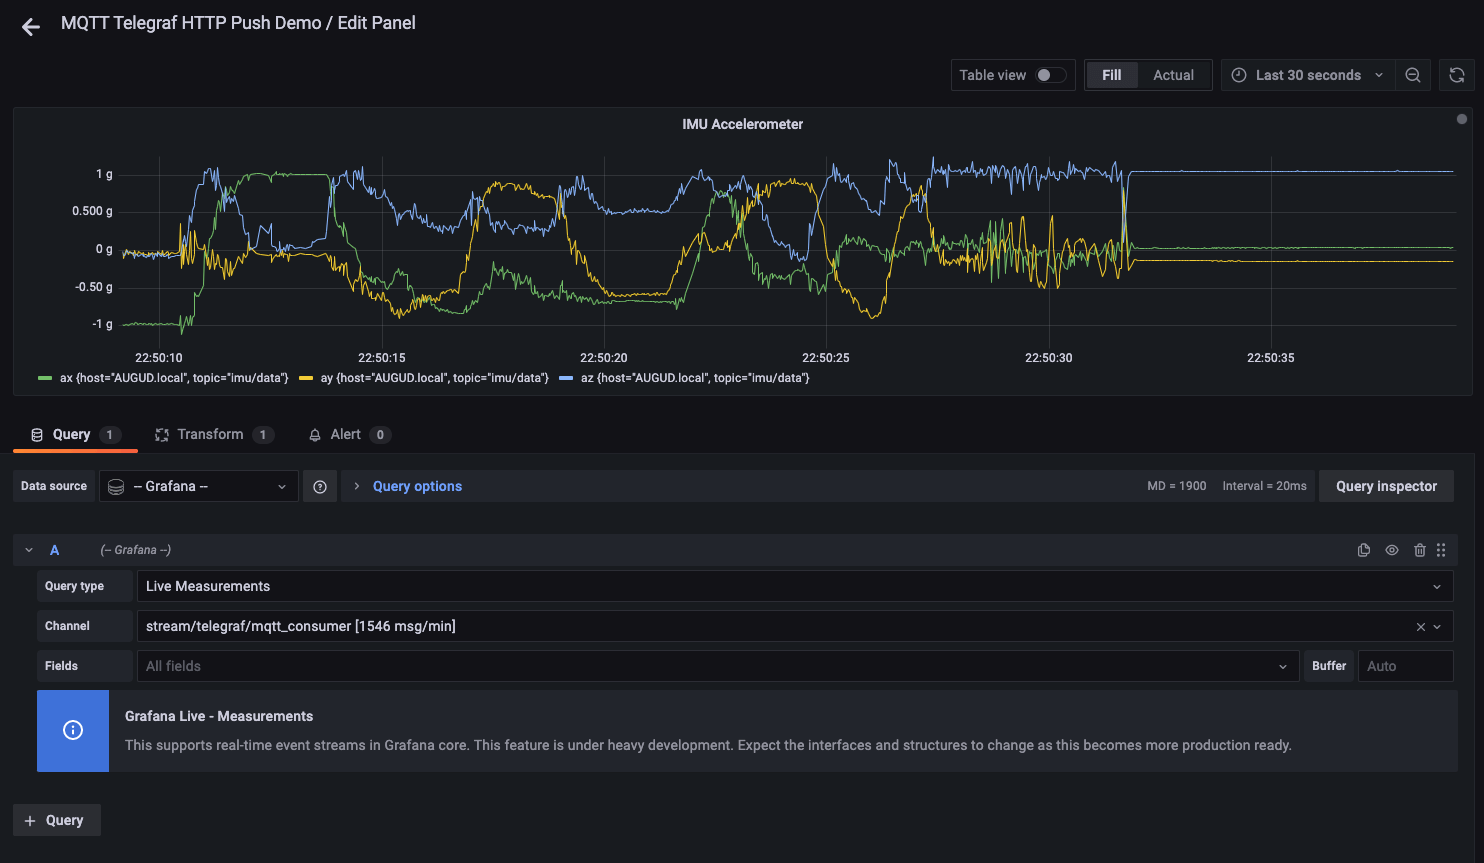
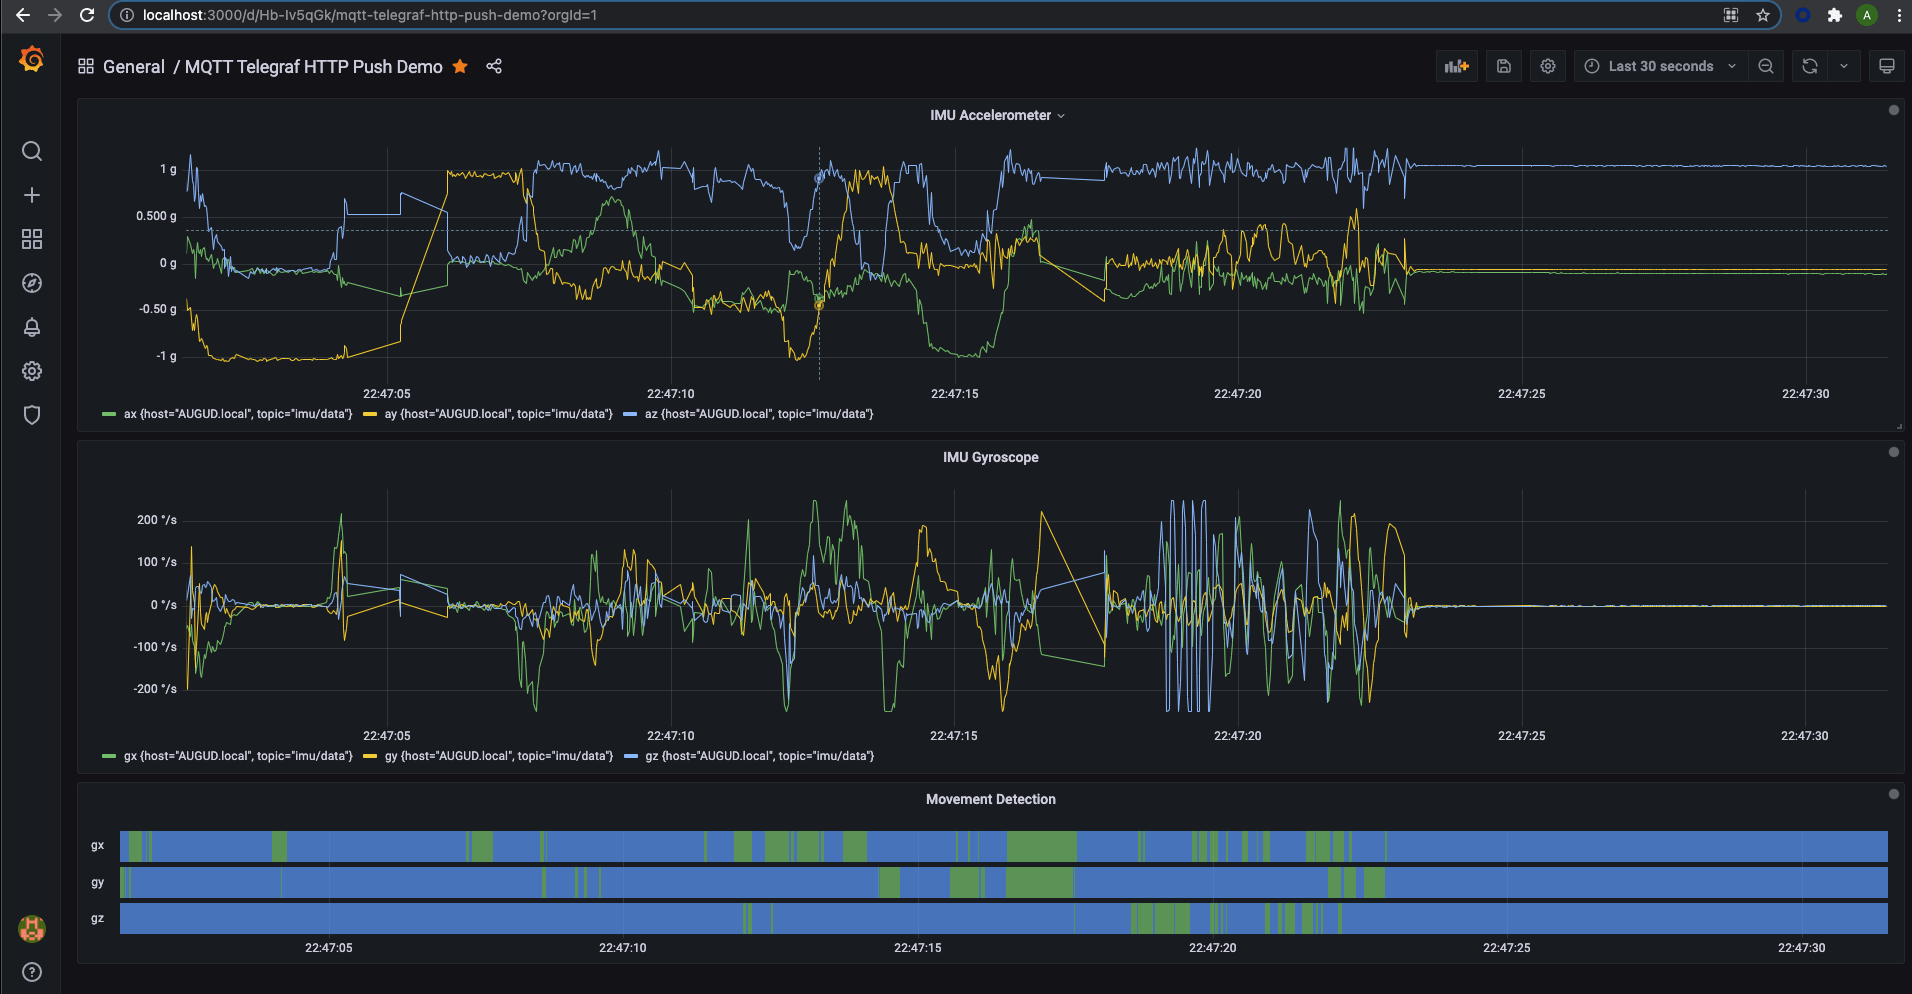
We created the same dashboard as before using the time series and timeline panels, to visualize the tri-axial data from the accelerometer and gyroscope.

For details on how to set up the individual queries for your panels, refer to our tutorial on streaming metrics from Telegraf to Grafana.

Conclusion
This simple demonstration showcases the versatility and flexibility of using Telegraf for scraping data from various multi-protocol sensor systems and using a single HTTP Push API end-point to ingest all that data into the Grafana Live engine for streaming. This is applicable to a variety of hardware systems’ speaking protocols such as AMQP, MODBUS, Fibaro, IPMI, RabbitMQ, KNX, OPC UA, etc. If you are interested in streaming Telegraf metrics to Grafana for your own application make sure to follow this guide for the setup details.


