How to use PromQL joins for more effective queries of Prometheus metrics at scale
We recently heard that a customer, a power user of Prometheus, was grappling with 18,000 individual rules for its metrics, because its setup involved creating an individual rule group for each generated metric. Surely there was a better, more efficient way to handle this scale of metrics?
In fact, we did come up with a solution, and this blog post will walk you through how you might benefit from it too.
What we had to work with
This organization was creating an individual rule group for each generated metric.
For example:
groups:
  - name: slo_metric
    expr: count(api_response_latency_ms{labelone="xyz", labeltwo="abc"} > 100)
    labels:
      reference_label: xyzabc123
The reason for the recording rule above is that the customer wanted to add the reference_label to the aggregated version of the metric. The reference label corresponds to two pre-existing labels already present on each series. The problem at hand was how to create the new aggregated series with the desired associated reference label without changing the underlying series?
In coming up with an alternative, we took the following into consideration:
Info metrics
An info metric in Prometheus is a metric that doesn’t encode a measurement but instead is used to encode high cardinality label values. An example info metric is node_uname_info.
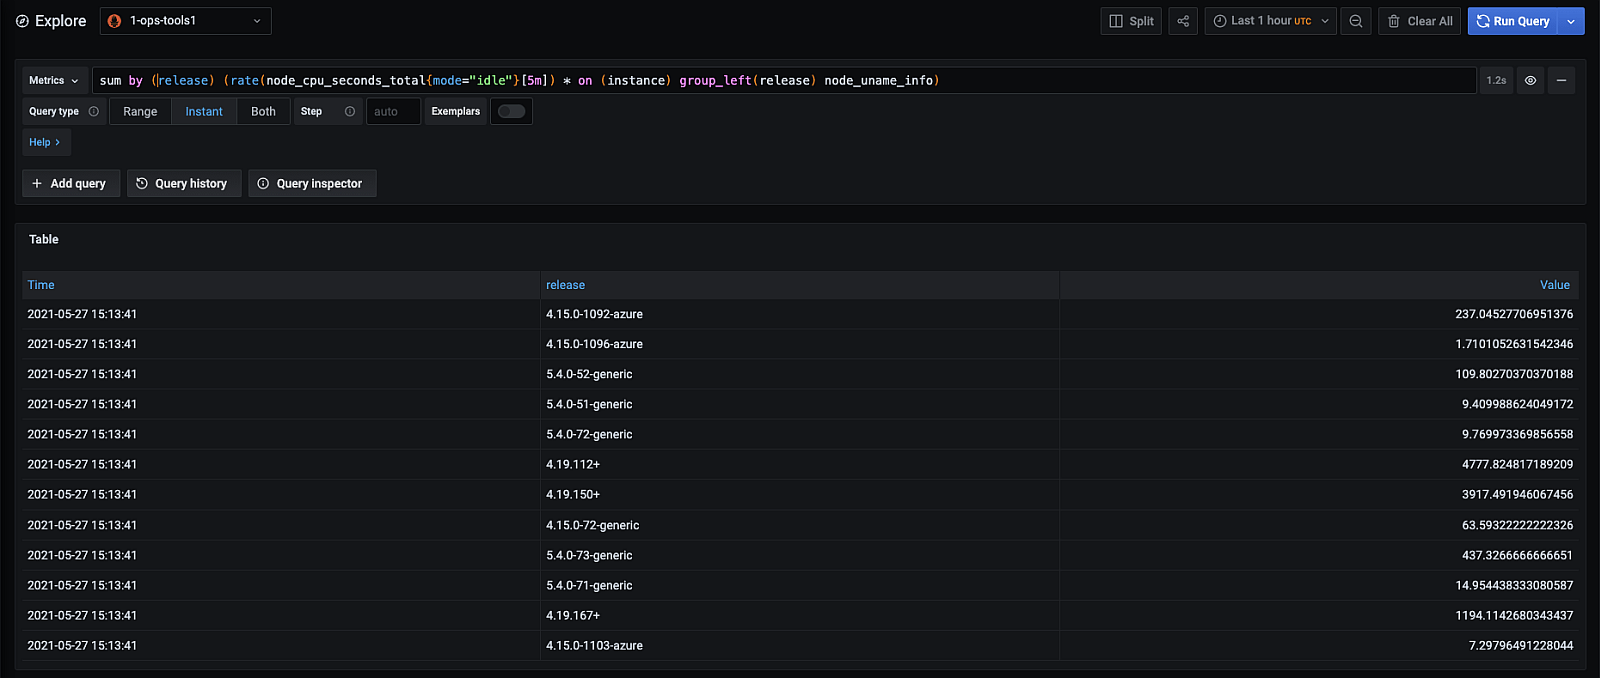
node_uname_info{cluster="dev-us-central-0", domainname="(none)", instance="localhost", job="default/node-exporter", machine="x86_64", namespace="default", nodename="dev-host-1", release="4.19.150+", sysname="Linux", version="#1 SMP Tue Nov 24 07:54:23 PST 2020"} 1The above metric is exposed by the node exporter and is a gauge with a measurement always set to 1. Even though this metric is not useful on its own, it can be useful in concert with other metrics. For instance, if you wanted to determine the CPU Idle time by OS release you would use the query:
sum by (release) (rate(node_cpu_seconds_total{mode="idle"}[5m]) * on (instance) group_left(release) node_uname_info)
The next question you may have is how can you easily create an info metric with the correct label values and quickly scrape them into Prometheus. You can always create an application instrumented with your desired metric but there is an even easier way. You can take advantage of the textfile_collector.
Textfile exporter
The Prometheus Node Exporter and Grafana Agent have support for a textfile collector. This allows the agent to parse and collect a text file containing metrics in the Prometheus exposition format. This functionality is important for quickly generating static metrics containing metadata that’s useful for PromQL queries.
Using the above functionality, you can create info metrics containing unique sets of labels that can be used in PromQL join queries with other metrics. All you need to do is to create a file that contains your desired info metrics and expose them to Prometheus. You can do this by hand or with a script.
For some example scripts that can be used to generate files containing metrics meant to be collected by the textfile collector, see the Prometheus community scripts repository.
Joins in PromQL
PromQL supports the ability to join two metrics together: You can append a label set from one metric and append it to another at query time. This can be useful in Prometheus rule evaluations, since it lets you generate a new metric for a series by appending labels from another info metric.
For more information on the join operator, see the documentation for Prometheus Querying Operators and check out these blog posts:
Bringing it all together
You can repurpose the tooling that generates the 18,000 rule groups to instead generate a Prometheus metrics file that contains the metric sli_info. This metric will contain the seal reference and the sealID, checkID, and any other label it appropriately maps onto.
Next, collect the metrics generated using the textfile collector built into the Grafana Agent and write them to Cortex.
Run a single rule per metric that uses a PromQL join to inject the appropriate reference label into the generated series.
For example, based on the above rule group:
groups:
  - name: slo_metric
    expr: count(api_response_latency{labelone="xyz", labeltwo="abc"} > 100)
    labels:
      reference_label: xyzabc
You would create the following info metric file:
sli_info{labelone="xyz", labeltwo="abc", reference_label="xyzabz"} 1This file would be collected by Grafana Agent. Then the following rule group could be used in Cortex:
groups:
  - name: slo_metric
    expr: count by (reference_label) ((api_response_latency * on (labelone,labeltwo) group_left(reference_label) sli_info > 100)
This would work for every metric with those label names and associated mappings.
Voila! You get the same result as the existing rule group, without the 18,000 individual rules.


