How Grafana helps organizations manage SLOs across multiple monitoring data sources
“SLO is a favorite word of SREs,” Grafana Labs Principal Software Engineer Björn “Beorn” Rabenstein said during his talk at KubeCon + CloudNativeCon NA 2019. “Of course, it’s also great for design decisions, to set the right goals, and to set alerting in the right way. It’s everything that is good.”
So what happens when things go bad?
The basic idea for alerting on service level objectives (SLOs) is to measure the error rate over a variety of time frames and then alert on them. You page quickly if you are burning your monthly error budget quickly, and you only ticket people if the error budget is burning slowly enough that a response during work hours is acceptable.
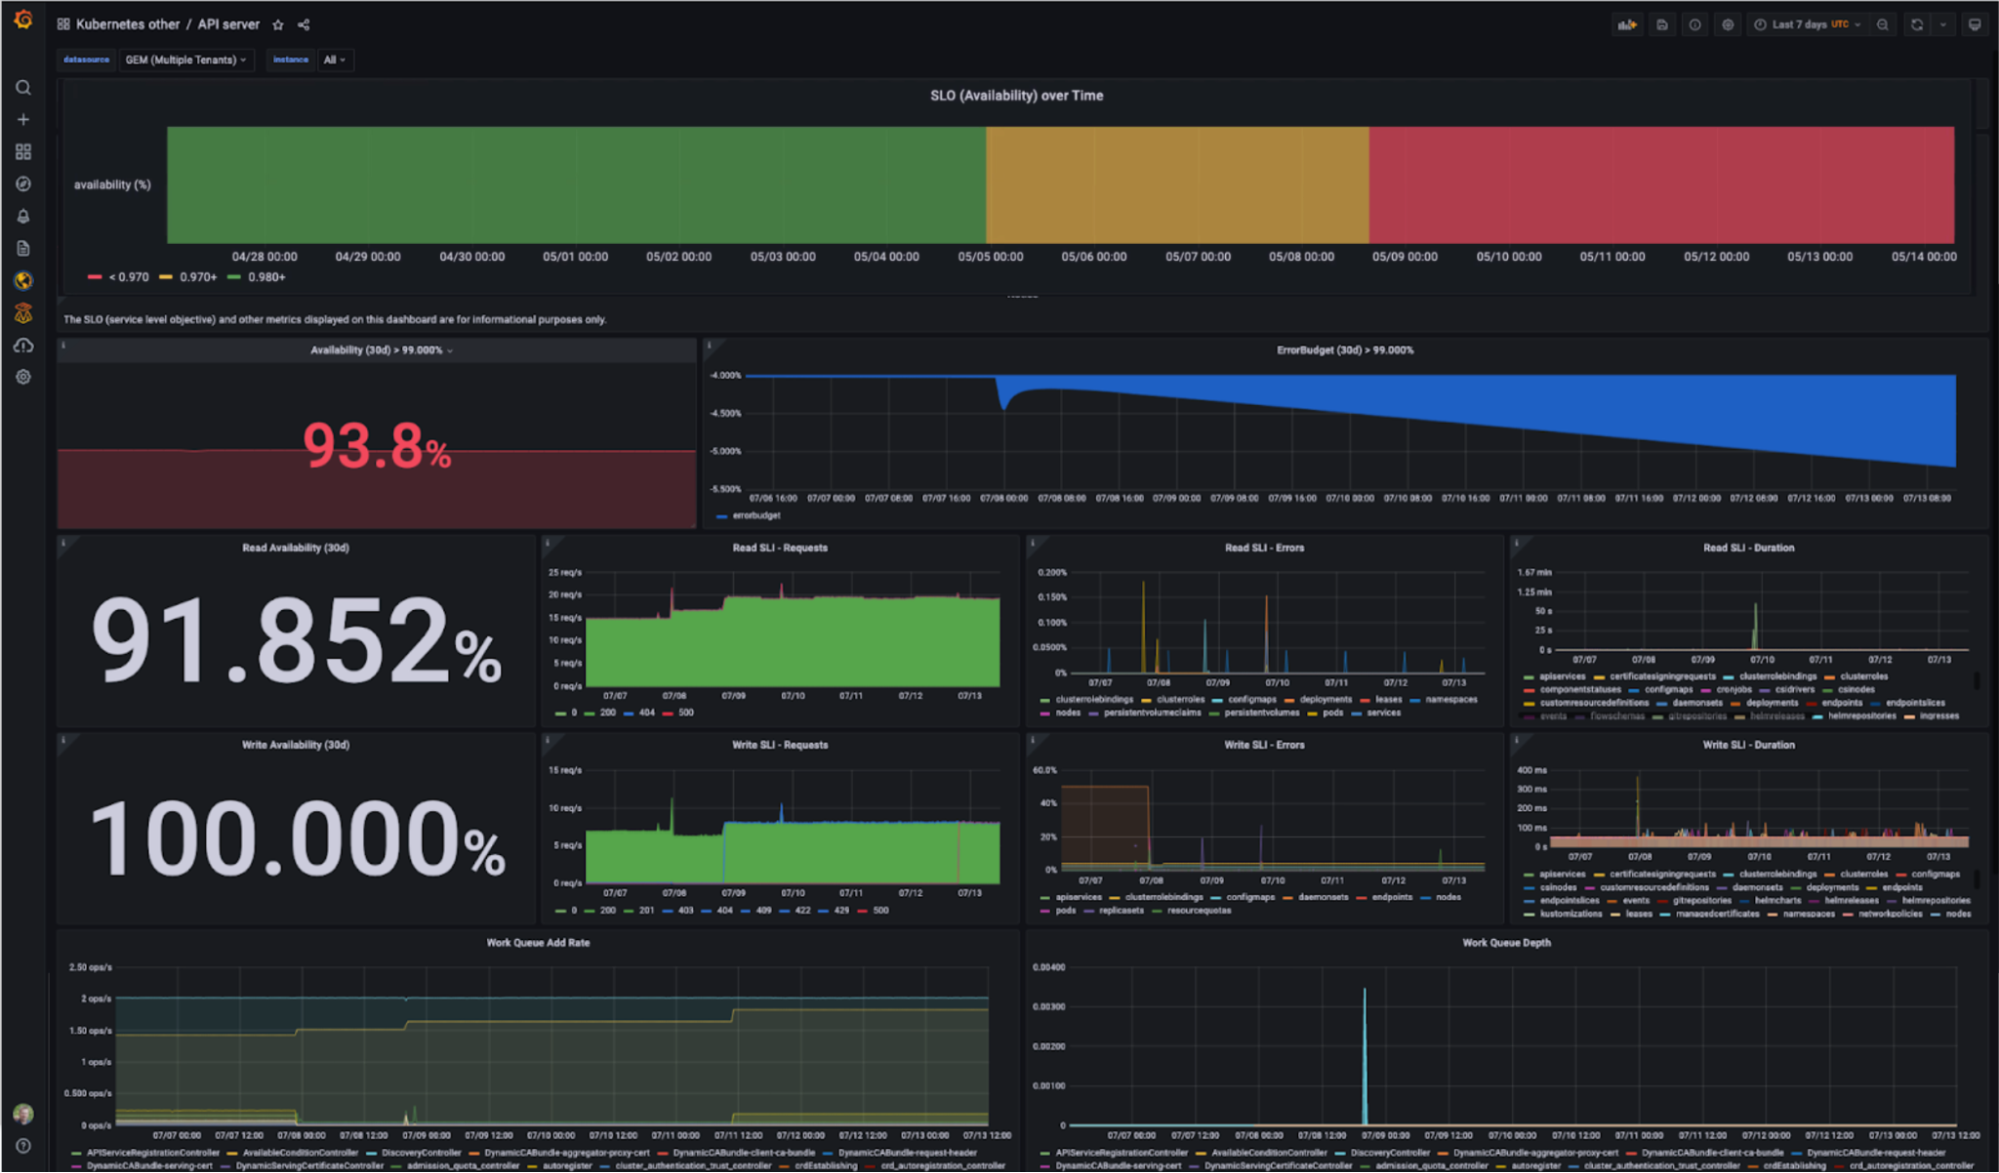
Site reliability engineers (SREs) often determine the health and performance of an application by closely tracking a set of service level indicators (SLIs). In this blog post we’ll review how Grafana makes visualizing SLIs and error budgets simple and easy to act on when your SLO is in jeopardy.
An all-in-one solution
SLIs are often measured with multiple systems for metrics and APM solutions.
Whether you work with data sources that are Prometheus-based or not, Grafana Enterprise — our observability stack for self-managed environments — has the unique ability to bring together disparate data sources into one comprehensive overview. All the information can then be combined into interactive dashboards, using server-side math expressions to unify error budgets from multiple sources.
For example, an overall SLO graph can be created by combining the last 30 days of data from two SLIs reported by Grafana Cloud Metrics and AppD.
- Error Budget of SLI 1 [Grafana Cloud Metrics] + Error Budget of SLI 2 [AppD]

SLI violations and error budget overages can also be highlighted using Grafana’s built-in rules-based formatting. The information can then be easily shared to a wider audience: All panels in Grafana are exportable and embedable for use in downstream systems.
Creating and actioning SLIs
SLIs can measure single entities like hosts, pods, or services, or across multiple entities using metric labels.
With Grafana Enterprise Metrics or Grafana Cloud Metrics, SLIs from Prometheus-based data sources are built using the power of PromQL. Grafana Cloud — our fully managed observability stack — and Grafana Enterprise both also have the ability to create and manage SLIs via API or Grafana’s next-generation alerting plugin, both of which are flexible and actionable.

When SLIs are breached, they can be actioned by integrating with downstream systems like PagerDuty, ProdMon, or automation end points to alert SRE teams.
The best part? There is no limit to the number of SLIs that can be tracked using Grafana. Some of Grafana’s largest customers monitor thousands of applications, which translates into tracking tens of thousands of SLIs across their environments.
Establishing effective SLOs and SLIs are best practices that you want to bring to your organization to ensure your system’s uptime without burning out your teams. And Grafana makes the process of setting up and monitoring these metrics seamless.
To request a demo of Grafana Enterprise, click here. Or to sign up for a free Grafana Cloud trial, learn more here.


