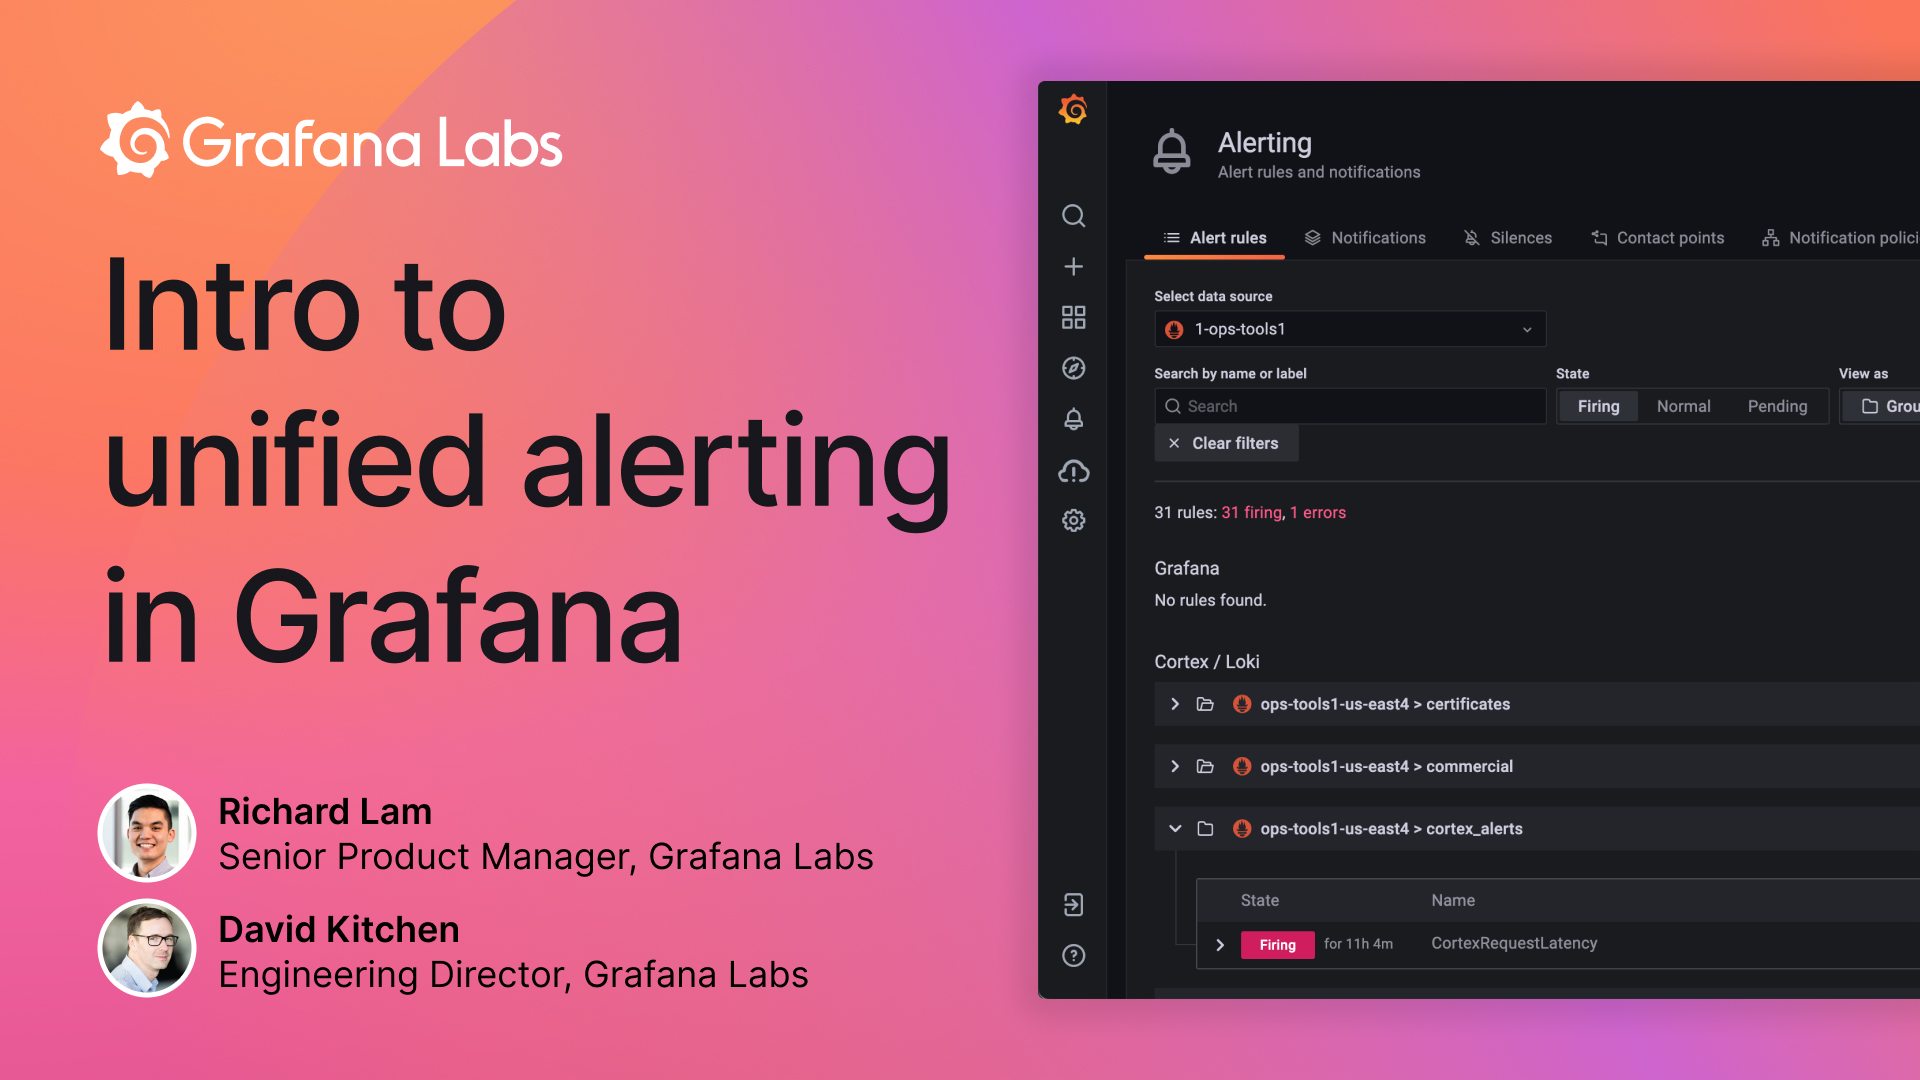
Learn more about the new alerting system in Grafana in this week's webinar
One of the big headlines from the Grafana 8.0 release last month was the new unified alerting system for Grafana. Alerting has long been a popular topic for feature requests in the Grafana project, and we were excited to deliver a complete overhaul with 8.0, unifying Prometheus alerting and Grafana alerting in the same user interface for viewing and editing alerts. This provides a common experience around alerting for all Grafana users and data sources — whether you’re using the open source version or the Enterprise and Cloud stacks.
So what does this mean for you? Tune into our “Intro to unified alerting in Grafana” webinar tomorrow, July 22, at 9:30 PT / 12:30 ET / 16:30 UTC to get a walk-through of the new alerting system.

During this webinar, Engineering Director Dee Kitchen and Senior Product Manager Richard Lam will show step-by-step how to create and interact with an alert in the new system.
For users of the traditional Grafana dashboard alerts, you’ll learn what you can expect as you migrate to the new system, as well as some of the improvements we’ve made along the way.
For users of Prometheus-style alerts and Grafana Cloud alerting, you’ll get a demo of how the new system makes it easier than ever to manage these alerts, all directly within Grafana.
We hope you’ll join us!


