How astronomers use Grafana dashboards to read the stars (and their data) on the SOFIA airborne observatory
There’s stargazing, and then there’s SOFIA.
The SOFIA airborne astronomical observatory is a joint NASA and German Aerospace Center endeavor consisting of a modified Boeing 747SP aircraft with a 2.7-meter reflecting telescope and a team of astronomers onboard.
“The nice thing about airborne astronomy is that you get above the atmosphere, similar to a satellite, but you also have the fact that you can return home and you can swap out different instruments,” said Ronan Higgins, an astronomer at University of Cologne.
SOFIA also serves as a more immediate test bed for new types of instruments, receivers, and detectors. “It gives you a flexibility that you don’t have with a satellite system,” said Higgins.
During GrafanaCONline 2021, Higgins launched his talk about data monitoring on an airborne astronomical observatory with a look at how Grafana — which is deployed as part of the upGREAT instrument software stack — has proven to be a vital asset onboard SOFIA.
“One of the problems we had initially was that we had a lot of different subsystems all with their own different logging and graphing systems and to bring all that data together was becoming problematic,” said Higgins.
So for the last three years, Higgins and his team have been funneling about 2GB of data that’s collected during each flight into InfluxDB and Grafana, which help monitor multiple subsystems on SOFIA in one unified place.
Higgins then walked through real-life use cases of how astronomers on SOFIA use Grafana dashboards for data visualization and to investigate data quality issues — all while still in flight.
Data quality was “one of the main goals” of their monitoring stack. “We want to have the best data quality,” explained Higgins. “One of the issues is when you don’t get great data quality, you want to correlate that [problem] with something that happened on the aircraft, or at least learn a lesson so that you can fix that one going forward.”
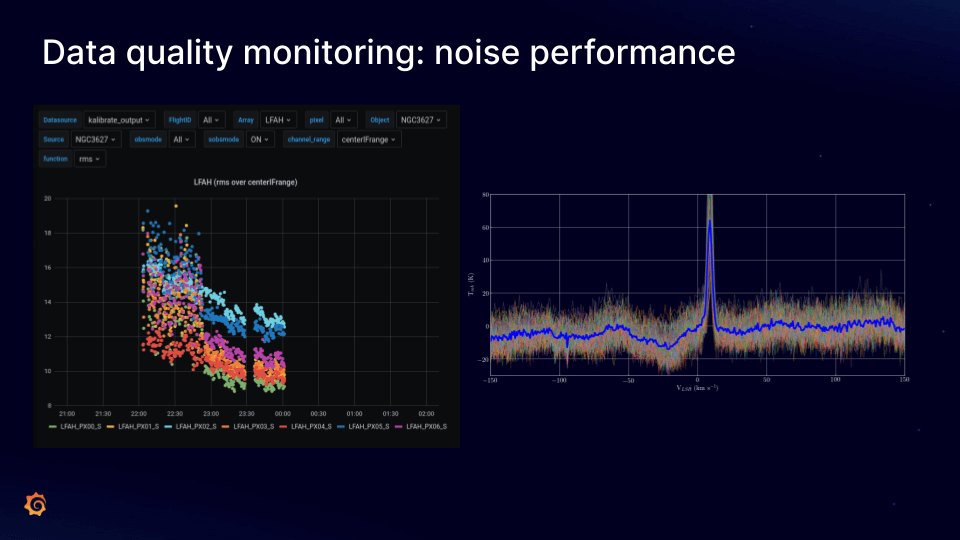
One example is monitoring noise performance. If the noise level is above a certain threshold that signals that there’s a baseline issue that can then lead to confusion in the scientific interpretation of the data collected during a flight.

In the Grafana dashboard above, the plot line should be flat, but there’s a disruption that then settles down. “This is the type of thing that we would follow up with in flight,” explained Higgins. “What should we do? Do we change the state of the receiver? Did the weather change? Did we climb? We know that with Grafana we can correlate [this issue] to different states of the system.”
Finally Ronan discussed what’s written in the stars for Grafana and SOFIA in the future. As self-admitted “novice users,” Higgins said the team plans on leaning more on Grafana’s alerting system to flag data quality issues in-flight. In addition to using Grafana’s existing tools, there are also ambitions to develop a custom plugin which can link data points to astronomical data and an interactive reduction pipeline using Grafana as a time series display backend.
“This is the type of world that Grafana opens up for astronomers,” said Higgins.
And there are more astronomers joining the Grafana universe. “There is a general trend in astronomy in moving to a Grafana-based system for system-wide monitoring,” said Higgins. “It’s definitely been a big step up for us and has made our lives a lot easier.”
Learn more about how Grafana works on the SOFIA airborne astronomical observatory by watching the video of the full session. All of the GrafanaCONline 2021 sessions are now available on demand.


