How Salesforce manages service health at scale with Grafana and Prometheus
Cloud-based software company Salesforce is the world’s No. 1 customer relationship management platform (CRM). It helps businesses connect their marketing, sales, commerce, service, and IT teams through one integrated platform.
During a GrafanaCONline 2021 presentation, a team from Salesforce discussed how they use Grafana’s dashboards, Prometheus, and plugins to visualize and manage overall service health and alerts, as well as drive overall product availability insights across the company. “We leverage Grafana Labs’ cloud native solution to help us manage low-latency alerting and to help with auto-remediation and auto-scaling,” Frances Zhao-Perez, Senior Director of Product Management, said.
The group began by addressing Salesforce’s technical setup, which includes both Grafana OSS and Grafana Enterprise. First, Salesforce’s Principal Software Engineer Pavan Rangavajhala focused on how the company derives real-time service health insights using Grafana. He highlighted the custom Grafana panels they rely on and discussed some of the features they use — such as repeat rows, pagination, and custom pop-ups — to create dynamic and complex dashboards.
Lead Software Engineer Sanjana Chandrashekar then outlined Salesforce’s highly distributed cloud native architecture, which required “a reliable alerting system that can provide near real-time feedback,” she said. To fill that need, they use hyperlocal observability (HLO), a backend set of open source and cloud native observability tools that bundles Prometheus, Grafana, and Alertmanager. It works in conjunction with Argus, Salesforce’s time series monitoring platform, to enable a comprehensive low-latency and highly available alerting solution.
Chandrashekar explained that there’s been a big push to allow for automation to make managing the alerting and dashboard solutions easier, which led the company to develop automation tooling. She then broke down some of the benefits that the tools offer in the context of Grafana dashboards — namely templating, versioning, extensibility, and integrations.
Software Architect John O’Brien followed that up with a presentation about the types of dashboards that work (they’re usable, understandable, and comprehensive), and walked through three of Salesforce’s Grafana dashboard use cases: trends, health checks, and performance monitoring. He also touched on dashboard quality standards and shared a list of the Grafana features that Salesforce finds valuable, such as the ability to use $variables in titles and other text, and Javascript callouts in the HTML panel.
Finally, Software Engineering Manager Joe Pallotta, who works on Salesforce’s Commerce Cloud, illustrated how it all comes together. The Commerce Cloud platform serves 2 billion shoppers every month, and Saleforce’s customers generate more than 3 million transactions per day, at historic 99.99% platform availability. “Grafana is the tool that we use every day to monitor how well those customers are performing on the platform to ensure their success during the most critical sales events,” he said.
He then presented a case study of the company’s monitoring strategy during the most important holiday shopping period for their customers: Black Friday through Cyber Week. Grafana, which is part of their metrics stack, “is the window pane that provides visibility to how well our customers are performing on the platform,” he said.
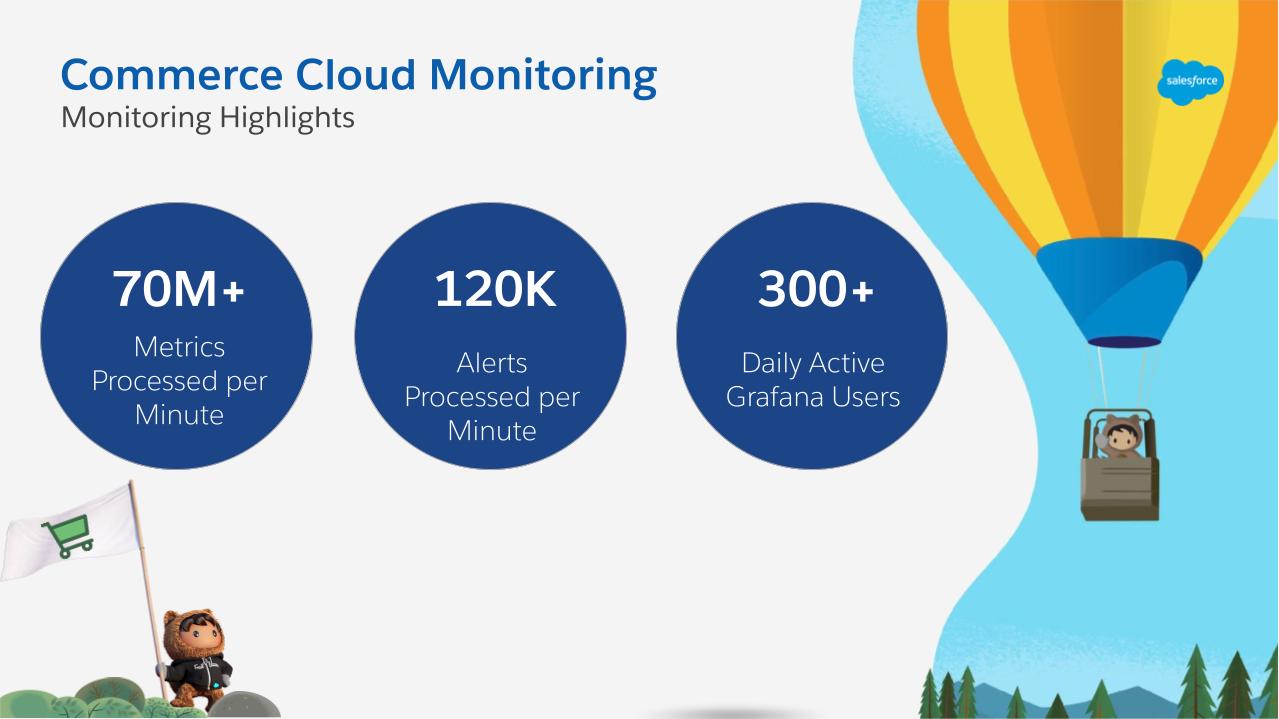
Salesforce processes more than 70 million e-commerce metrics per minute. From those metrics, the company’s internal teams have configured thousands of unique alert definitions. Grafana alerting, in combination with Salesforce’s own alerting service, processes more than 120,000 alerts per minute to provide proactive monitoring capabilities to its internal teams. Each day, Grafana serves more than 300 active users across the company’s internal teams.

Pallotta showed off one of the primary Grafana dashboards they use to effectively monitor customer performance on the platform, and explained how they purposefully architected the dashboard to render key insights as quickly as possible. It features an overview section that displays six distinct above-the-fold graphs that allow users to quickly assess the activity across the customer sites and the overall health on the platform.
Among the data Salesforce can observe is high system utilization, CPU per server, and database connections. Based on what the company sees, it can steer investigations to uncover the root cause of any issues customers may be experiencing. Pallotta then walked through one of those full investigations to show how Grafana graphs were used to collectively solve an issue.
“This quick root cause analysis allows our teams to proactively identify issues with our customers,” he said. “And with enough detail, that allows the customer to quickly address it and our internal teams to remedy it.”
Learn more about how Salesforce uses Grafana — and see the exact dashboards the team uses on a daily basis to troubleshoot and ensure its Commerce Cloud customers continue to have a good experience — by watching the video of the full session. All of the GrafanaCONline 2021 sessions are now available on demand.


