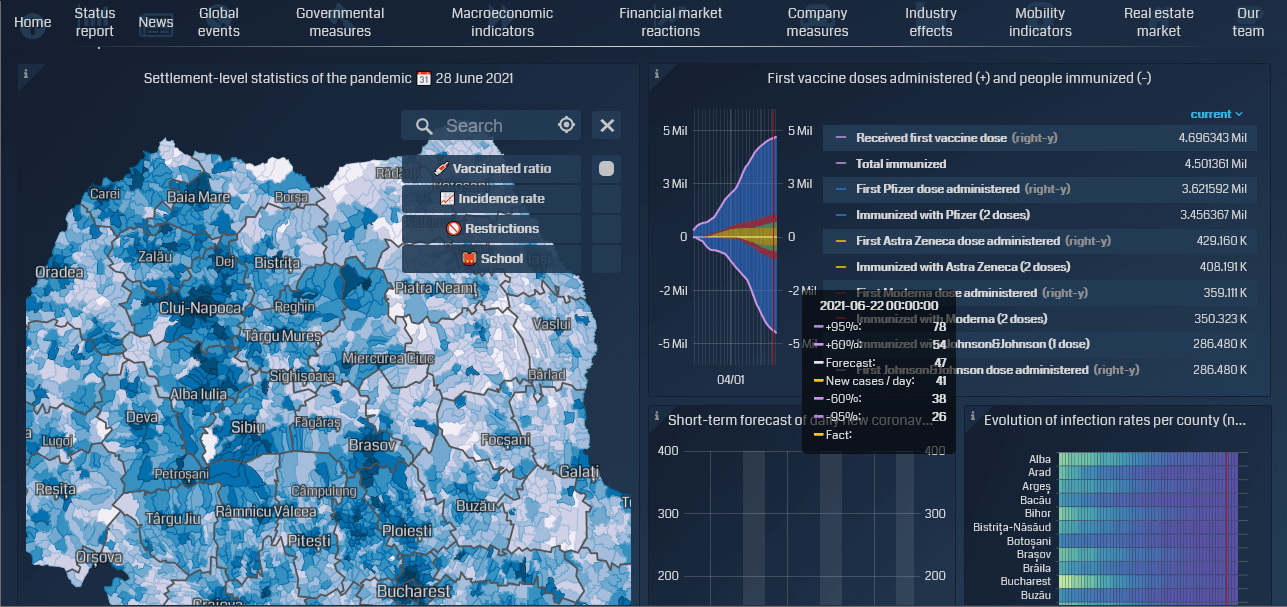
Using Grafana, academics created a next-level dashboard tracking the impact of Covid-19 in Romania
When Covid-19 hit Romania, it was difficult for ordinary citizens to get good information about the pandemic and its escalating impact on the country. The government, presiding over one of the least developed healthcare infrastructures in the European Union, was releasing bulletins via PDF and text that were neither timely nor all that accurate.
Into the breach stepped a team of six volunteers—five economists and a data scientist—operating out of Babes-Bolyai University. Using Grafana, they created the Romanian Economic Impact Monitor, a comprehensive Covid-19 information site that correlates government actions with the evolution of the pandemic and tracks relevant economic indicators in near-real time.
“We wanted to have a common dashboard where the public can go in and inform itself,” Dénes Csala, Assistant Professor at Lancaster University, said during his GrafanaCONline 2021 presentation. “Our reasoning was coming from the role of the university as a public institution during times of crisis. Perhaps the best role it can take is that of informing the public.”
At the outset, the team considered options including coding the entire site themselves in D3.js. “We wanted to check out quite a few solutions,” said Csala. “But the amount of work necessary to keep updating it and the work that would have been needed just sort of voted against it.” Grafana turned out to be the right solution not only because of the ease of implementation, but also because it gave them the flexibility to customize a landing page that delivered a diverse array of layered data that paints a detailed picture of the pandemic.
Leveraging Grafana 7.0, the customized landing page surfaces an incredible amount of content at a glance. Visitors are met with twelve single stack boxes conveying key indicators ranging from number of cases and deaths to unemployment figures and google mobility index data. Scrolling down takes you to an interactive country map and an array of annotated graphs.

The site itself is organized into categories (constructed as Grafana rows) such as Macroeconomic Indicators or Government Measures. “Each of these sections is a different context for the pandemic,” said Csala.
In his presentation, Csala walked through the various plugins and custom workarounds his team utilized. “Bear in mind that none of us are actually software engineers,” said Csala, joking that they had to use the “band-aid method” at various points. “But we did make it work. We have been operating for about a year now. And now we are one of the most visited Covid information sites in the country.”
Learn more about how Csala and his colleagues constructed the Covid-19 Romanian Impact Monitor with Grafana by watching the video of the full session. All of the GrafanaCONline 2021 sessions are now available on demand.


