
Grafana dashboard showcase: Visualizations for Prometheus, home energy usage, GitHub, and more!
The Grafana community is one of the most vibrant in all of web development. And to celebrate the conclusion of GrafanCONline, the launch of Grafana 8 and Tempo 1.0, and so much more, we’re pleased to share this dashboard showcase.
(And in case you missed any of the great sessions at GrafanaCONline, the videos are available on demand now!)
Each of these 12 dashboards was built by our community, for our community. They are available on our website, and you can easily add them to any Grafana instance by copying-and-pasting their dashboard ID.
Now, let’s check out some dashboards!
Grafana Loki dashboard for NGINX service mesh
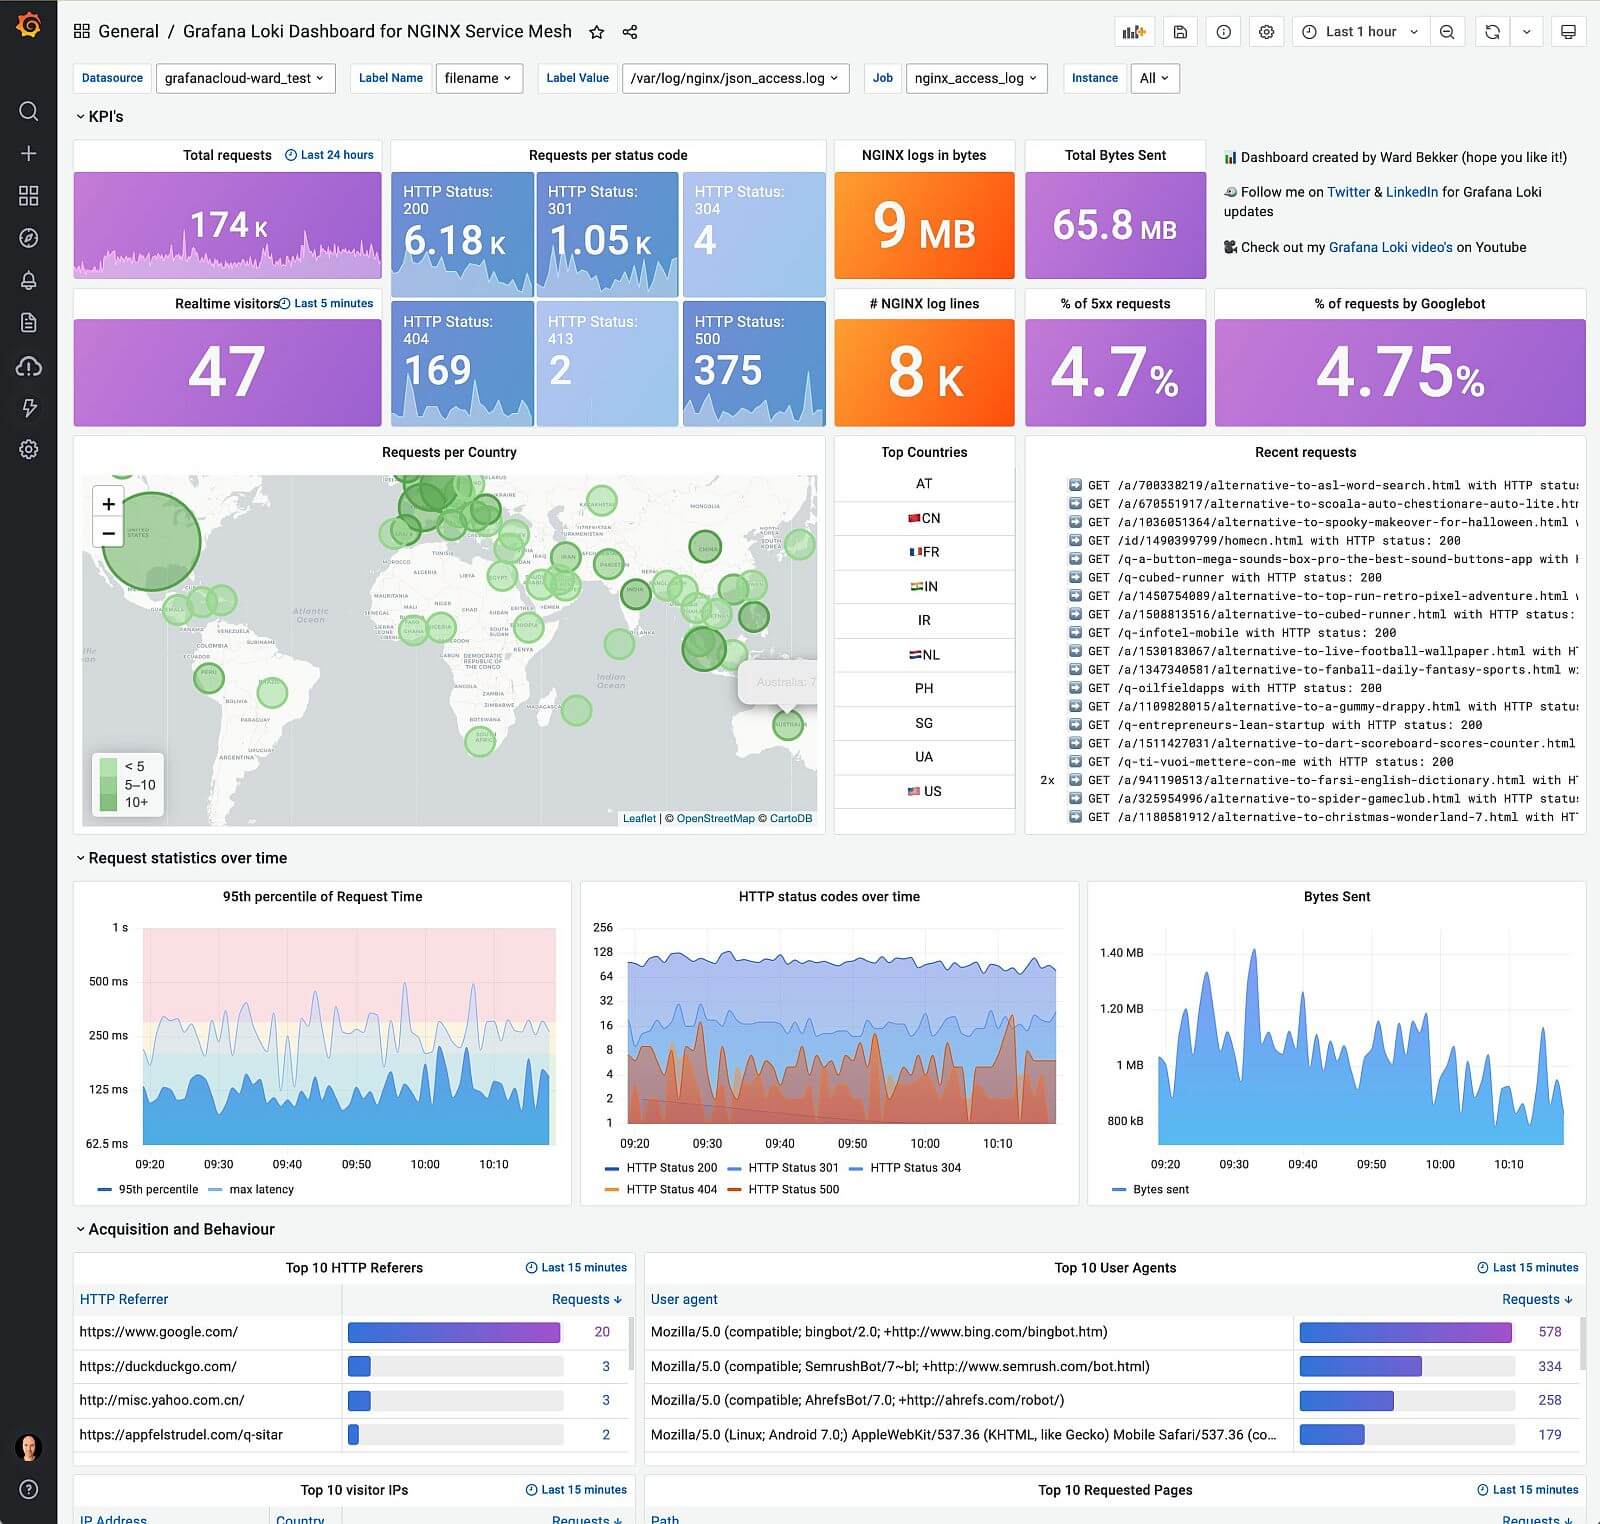
With this incredible new dashboard and related integrations created by Ward Bekker, Grafana Cloud users can monitor global traffic and dozens of other key metrics. Check out this blog post for more details, full instructions, and a demo sandbox application.
VMware vSphere dashboard

Jorge de la Cruz from Veeam Software built this high-level dashboard for VMware vSphere compute virtualization platform monitoring using the InfluxDB data source and Telegraf.
Valheim server dashboard

Brian Forbis created this dashboard to monitor your Valheim server, tracking information using mbround18/valheim-docker and cAdvisor.
GitHub default dashboard
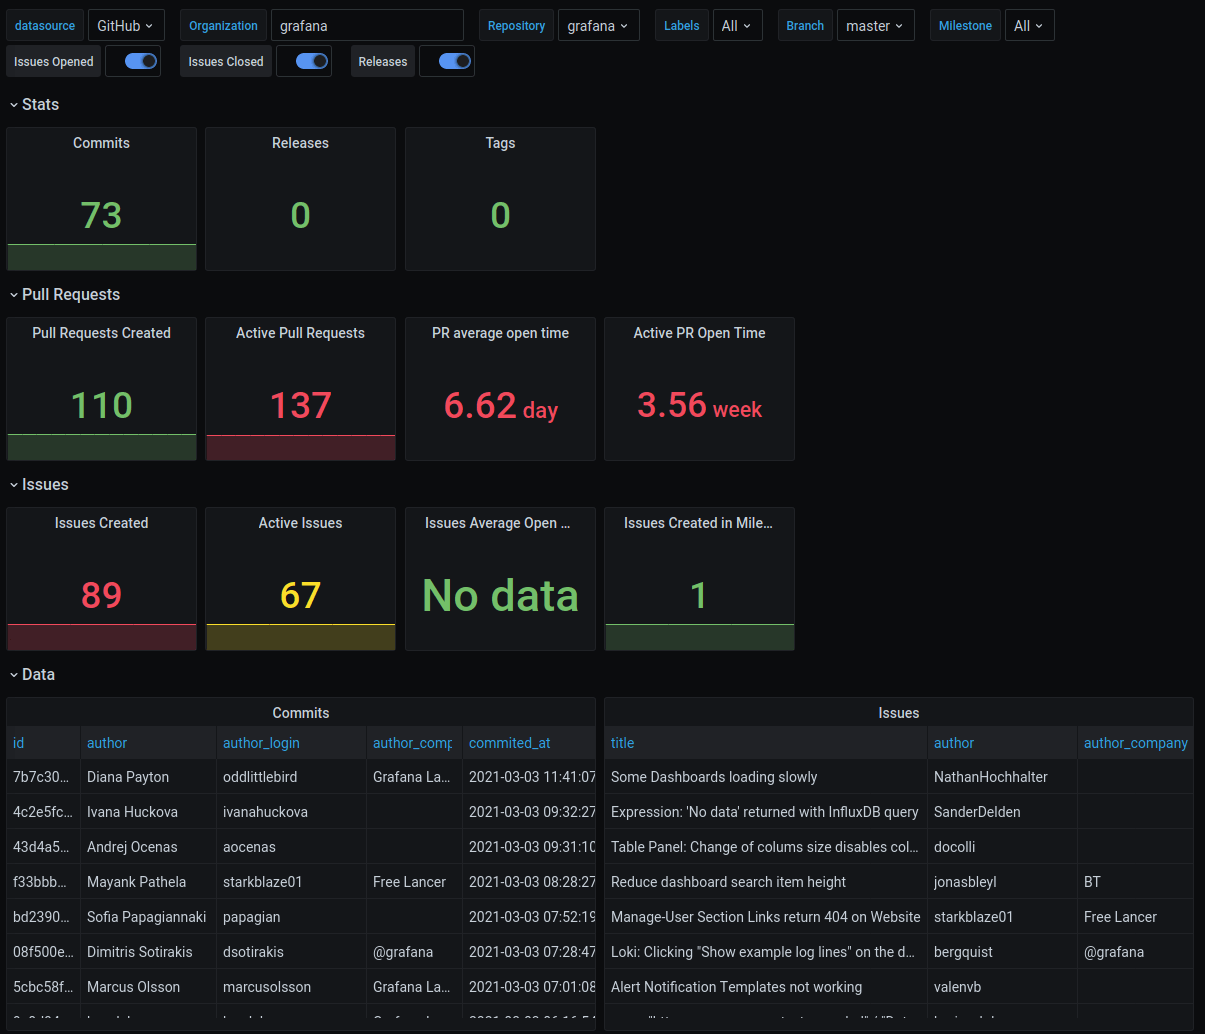
This dashboard created by Éamon Ryan uses a sampling of the available features in the GitHub data source to show interesting information about a given GitHub repository. A version of this dashboard is also bundled within the data source plugin.
For this dashboard to work, make sure you have a properly configured GitHub data source. By default, it will read from the grafana/grafana repository, but any can be used.
Read more about the plugin on the Grafana blog. The GitHub datasource plugin is also available for download here.
Splunk Infrastructure Monitoring / SignalFX dashboard

Another contribution from Éamon Ryan, this dashboard utilizes the Grafana Enterprise plugin for Splunk Infrastructure Monitoring. It is new and improved, and it should work with the sample data in every Splunk Infrastructure Monitoring / SignalFX account.
Jitsi Meet Exporter dashboard
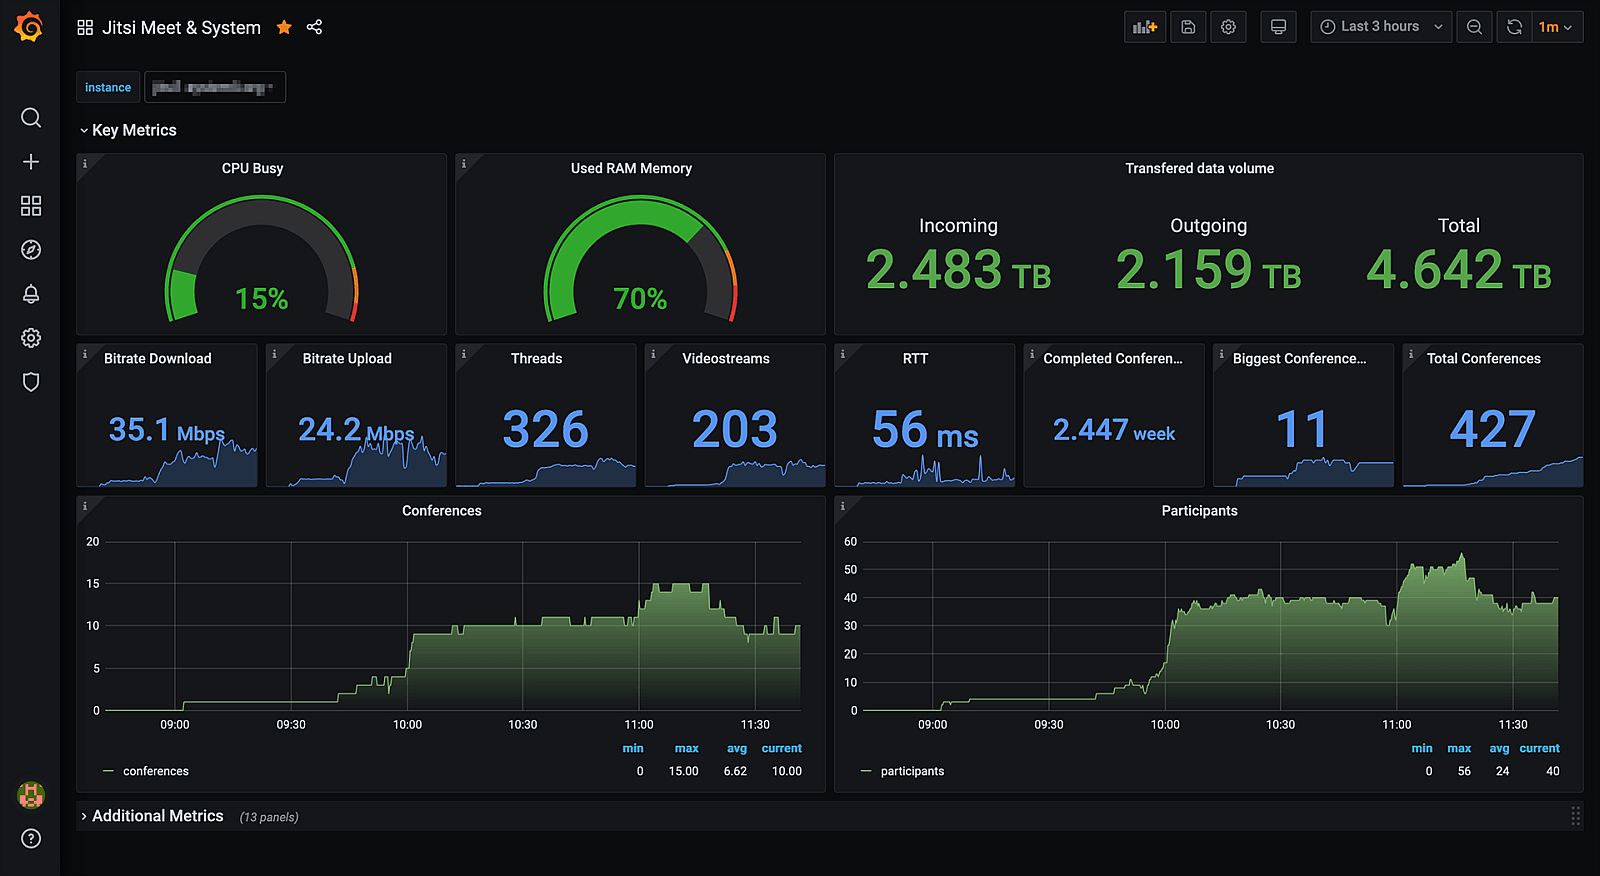
Behold systemli’s awesome dashboard for Jitsi Meet Exporter. It shows information about current conferences, participants, bitrates, and videostreams.
MinIO overview dashboard

MinIO’s high-performance object storage suite is software-defined and enables customers to build cloud native data infrastructure for machine learning, analytics, and application data workloads. With this dashboard, you can easily monitor all that and more.
Home energy usage dashboard
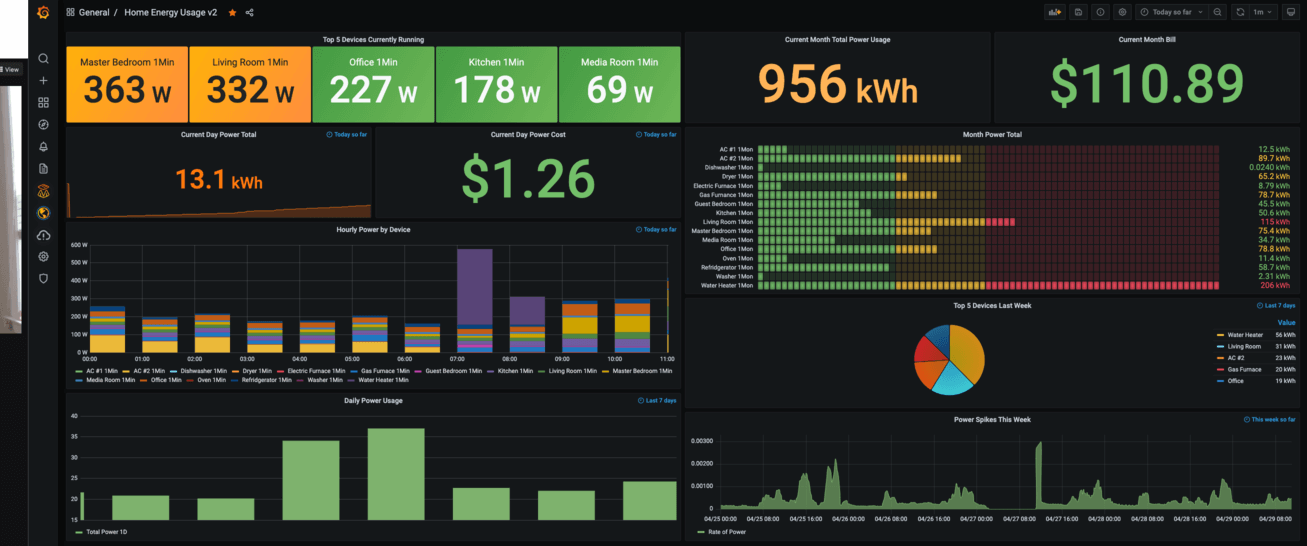
Want to build the ultimate smart home? Then check out Austin Freels’ Home energy usage dashboard. Austin uses HomeAssistant to connect to an energy monitor (Emporia Vue 2). Metrics are then natively exposed in Prometheus format from HomeAssistant, and the result is this glorious dashboard. Check out Austin’s blog post for more details.
Loki - Syslog AIO (all-in-one) dashboard
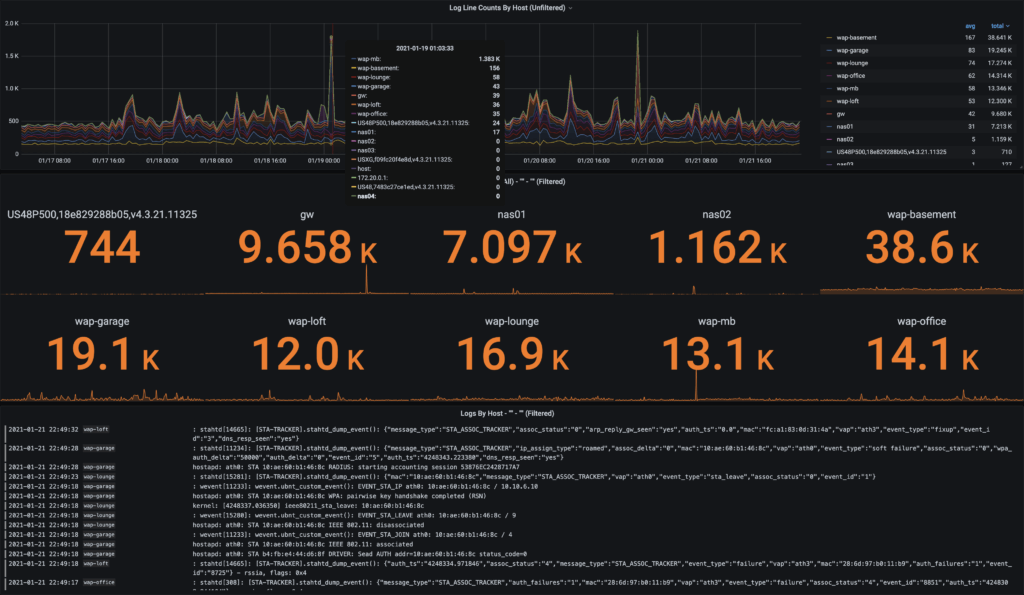
This Loki Syslog all-in-one example is geared to help you get up and running quickly with a Syslog ingestor and visualize logs. It uses Grafana Loki and Promtail as a receiver for forwarded syslog-ng logs.
Don’t forget to read Dave Schmid’s lovely blog post about this project, How I fell in love with logs thanks to Grafana Loki.
WeatherFlow overview dashboard
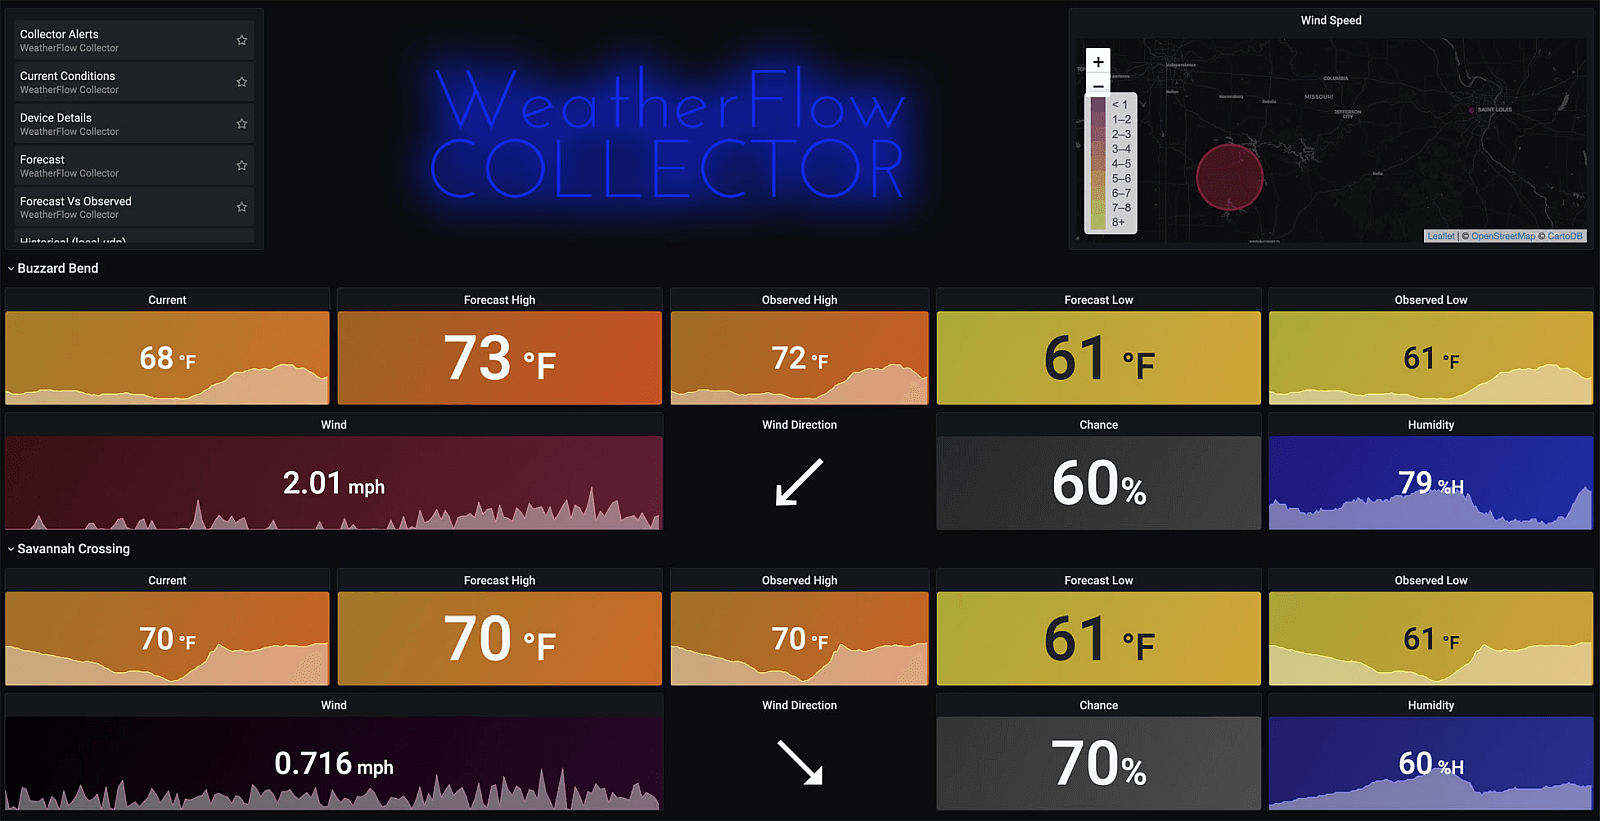
Dave Schmid brings it again with his WeatherFlow overview dashboard. This collection of Grafana dashboards, in conjunction with Schmid’s WeatherFlow Collector, will help you visualize your hyperlocal data, including current conditions, forecasts, rain and lightning events, and historical metrics.
See Dave’s blog post for more details.
PromEx dashboard

PromEx provides Prometheus metrics and Grafana dashboards for all of your favorite Elixir libraries in record time. (Read more about the project in this blog by Alex Koutmos, Founding Engineer at Whoosh.io.) Get information about how long queries are taking and where hotspots in your database are using the Ecto plugin. Use the BEAM plugin to see how much load you are putting on the Erlang virtual machine and to debug memory leaks and performance bottlenecks. See more screenshots here.
Kubernetes NGINX ingress Prometheus next-gen dashboard

And last but definitely not least: Based on the official Grafana dashboard, this is Farley’s 20th generation dashboard for monitoring NGINX ingress on Kubernetes with Prometheus.
Learn about dashboard design
Want to give your dashboards a makeover? Sign up for the free Getting started with Grafana dashboard design webinar on June 29!


