GrafanaCONline Day 1 recap: Grafana 8, Tempo GA, machine learning, ISS, and more!
GrafanaCONline 2021 is live! Join us over the next two weeks for more than 30 virtual sessions, ranging from demos of the new Grafana 8.0 release and technical deep dives around Grafana, Prometheus, Loki, and Tempo to insider looks at how companies are leveraging Grafana in observability, IoT, science, and business intelligence.
GrafanaCONline 2021 runs through June 17. Sign up (for free!) to tune in live or register for access to all the session recordings, which will be available on demand after GrafanaCONline ends.
Here’s what you missed from the first day of GrafanaCONline 2021:
Opening keynote
Grafana Labs CEO and Co-founder Raj Dutt celebrated more than 750K active installations of Grafana to date. He also provided a look back at the highlights of the past year, which included introducing the distributed tracing backend, Grafana Tempo, launching a forever-free plan for Grafana Cloud, and announcing a new partnership with AWS.
Grafana Labs CGO and Co-founder Torkel Ödegaard introduced Grafana 8.0 and gave a sneak peek at the new and improved visualizations, a live streaming feature, and an overhaul of the alerting system that unifies Prometheus and Grafana alerts.
Grafana Labs VP of Product Tom Wilkie announced the release of Grafana Tempo 1.0, Grafana Labs’ radically different approach to distributed tracing that is efficient, scalable, and cost-effective. (Interested in trying Tempo? Sign up for a free trial of Grafana Cloud, which includes 50GB of traces with the Grafana Cloud Traces service.)
Grafana Labs CTO and Co-founder Anthony Woods emphasized how OSS plays a prominent role in the Grafana universe and discussed how the company navigates the delicate balance of scaling OSS and developing enterprise features for customers. Then Grafana Labs VP of Customer Experience Roshni Sondhi walked through the success stories from both open source power users as well as Grafana Enterprise customers.
Finally, Raj returned to talk to Salesforce Chief Availability Officer Darryn Dieken and Senior Director of Cloud Management Frances Zhao-Perez about availability, culture, and adaptation — factors that became even more crucial to customers during the pandemic.

The keynote presentation, including the full Salesforce interview, will be available on demand here after the conference.
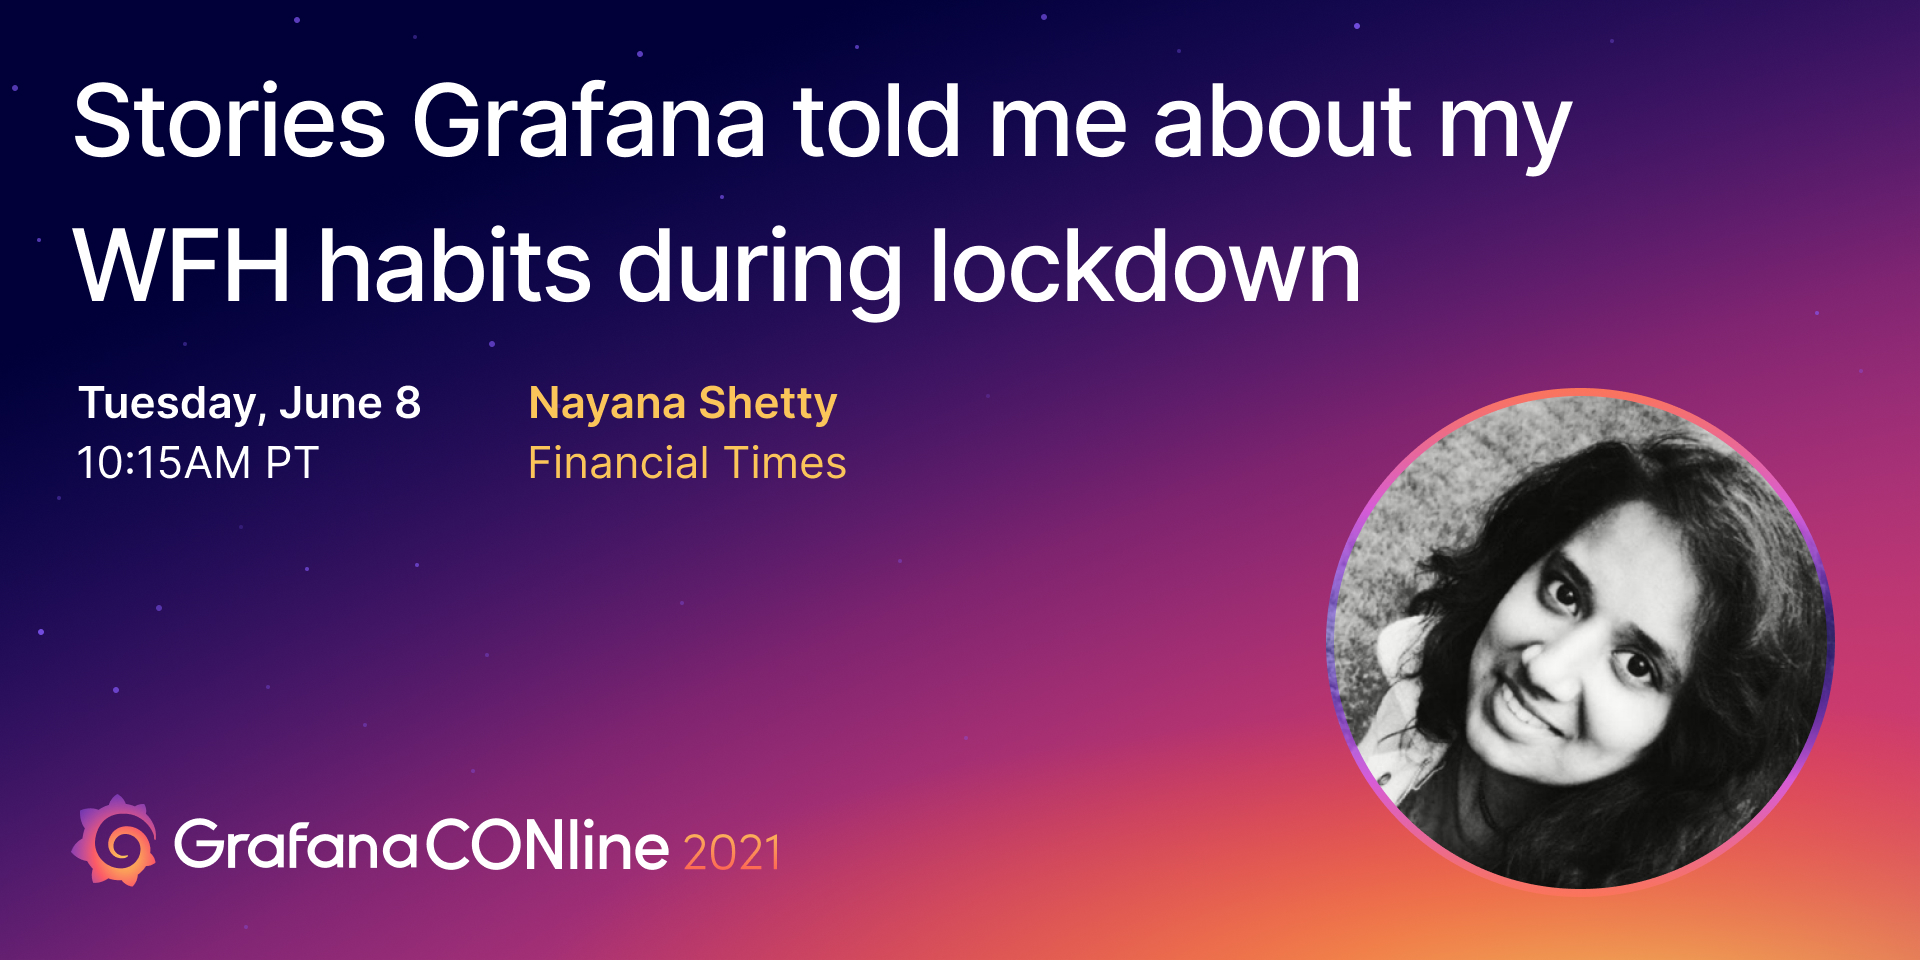
Stories Grafana told me about my WFH habits during the lockdown
What does remote work life really look like? Financial Times Principal Engineer Nayani Shetty wanted to find out, so she used Grafana and Graphite to track her daily routines during the pandemic: how often she took breaks, how much water she drank, how many meetings she had to sit through. Shetty walked through the Grafana dashboards she created using a few simple IoT devices to capture metrics throughout her day and explained how they helped her improve her WFH habits — and avoid burnout.

The session will be available on demand here.
The future of machine learning at Grafana Labs
Grafana Labs Distinguished Engineer Dan Cech andSenior Software Engineer Chris Marchbanks discussed how machine learning in Grafana can help us make advanced predictions and adaptive alerts, automate root cause analysis, and ultimately understand our systems better. The session highlighted how the Grafana team has deployed AI/ML to provide users with new tools to better understand metrics and produce high-quality forecasts and dynamic alerts. You can sign up for early access to the Grafana Machine Learning feature.

The session will be available on demand here.
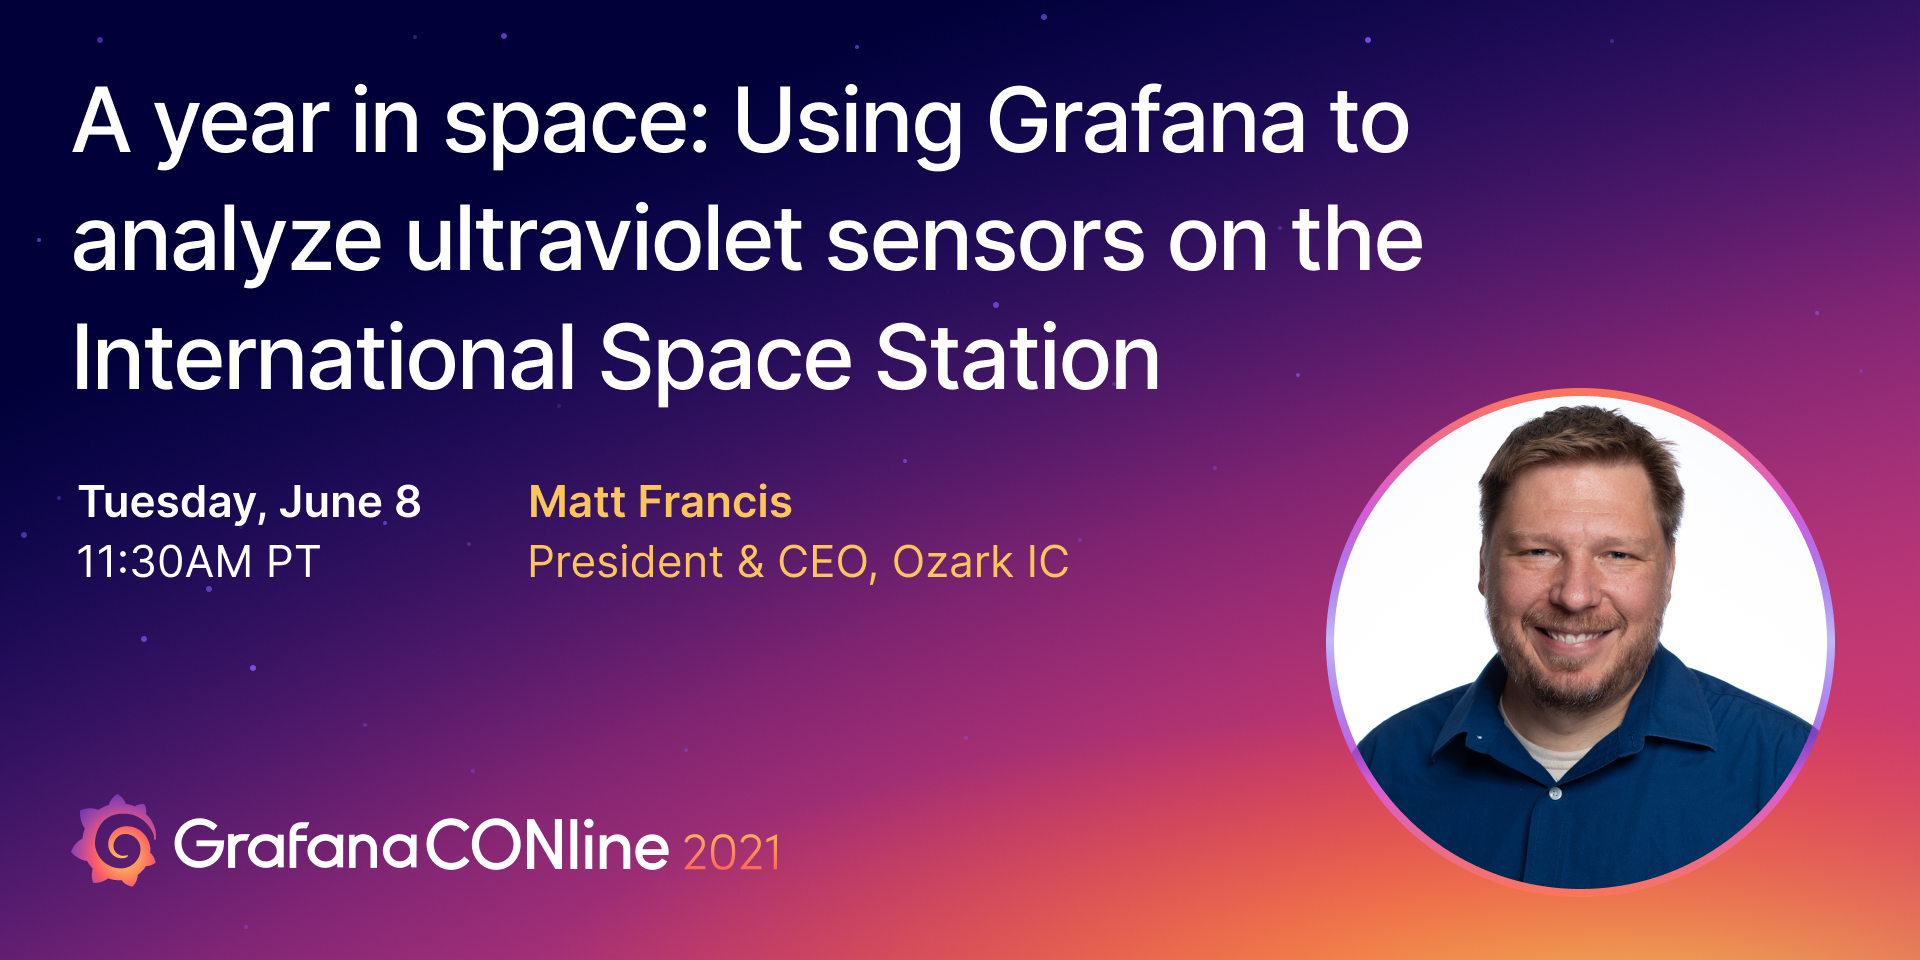
A year in space: Using Grafana to analyze ultraviolet sensors on the International Space Station
In 2019, Grafana took one small step for man, one giant step for monitoring kind. Ozark IC president and CEO Matt Francis shared how three Ozark IC ultraviolet (UV) detector modules were installed on the International Space Station (ISS) in January 2019 on the Alpha Space Test & Research Alliance’s MISSE platform. More than 2.7 million packets of live data were received from May 2019 until the experiment was deactivated for return by SpaceX’s last original Dragon capsule in April 2020. To sort through and understand the vast influx of information from the UV detection project, Ozark IC used a Grafana-based real-time information display system that was built for the endeavor. Francis shared the custom dashboards (complete with live video feed!) and talked about how the company uses Grafana for everything from cutting-edge space-bound nodules to down-to-earth use cases such as finances and IT infrastructure.

The session will be available on demand here.
Don’t miss today’s sessions
Grafana 8.0 deep dive at 9:00 PT, 12:00 ET, 16:00 UTC
with Alex Martin, Vardan Torosyan, and Tania Batieva from Grafana LabsPlugin showcase: Building a single pane of observability glass at 9:45 PT, 12:45 ET, 16:45 UTC with Christine Wang, Scott Lepper, Kevin Minehart, and Stephanie Closson from Grafana Labs and Volkov Labs Founder Mikhail Volkov
The pace of Prometheus and Cortex innovation at 10:30 PT, 1:30 ET, 17:30 UTC with Goutham Veeramacheneni, Suraj Nath, Russ DuBrock, Jacob Plicque III, and Christian Simon from Grafana Labs
How Robinhood scaled from 100M to 700M time series with Grafana Enterprise Metrics at 11:15 PT, 2:15 ET, 18:15 UTC with Robinhood Engineering Manager Austin McKinley and Software Engineer Stanley Kwong
Prometheus + Grafana: Answering FAQ at Roblox with data and visualization at 11:40 PT, 2:40 ET, 18:40 UTC with Roblox Principal Traffic Engineer Adam Mills
Check out the full GrafanaCONline 2021 schedule here.
And don’t forget you can connect with the Grafana community and get the latest updates from the Grafana Labs team during the event on Slack. Sign up here and join the #grafanaconline channel.


