
Grafana 8.0: Unified Grafana and Prometheus alerts, live streaming, new visualizations, and more!
Another GrafanaCON(line), another major release! And as I shared in the opening keynote today, Grafana 8.0 is the biggest, baddest release yet!
The big feature headlines around Grafana v8.0 include an overhaul of the alerting system; new and improved visualizations, including state timeline, status history, and histogram panels; live streaming; library panels that can be reused; and fine-grained access control that allows Enterprise customers to make sure everyone in their organization has the appropriate level of access.
We’ve also made upgrades to the performance and functionality of Grafana. There’s a refreshed look and feel with improvements to the user interface; data source query caching in Enterprise for faster dashboard loads; and better startup and load performance thanks to a massive reduction in initial download size, which means you can get to work faster and enjoy more responsive interactions with your dashboards.
To learn more, tune in to the Grafana 8.0 deep dive session at GrafanaCONline on June 9. In this talk, Grafana team members will demo more of the new features in this release. You can also take a look at what’s new in v8 in our new Grafana Play dashboard.
Finally, you can get started with Grafana in minutes with Grafana Cloud. We have free and paid Grafana Cloud plans to suit every use case — sign up for free now.
Now let’s get right to all the exciting new features in Grafana 8.0!

Alerting
Over the years, the top requests from the Grafana community have all been around alerting. Last September, we introduced Prometheus-style alerting in Grafana Cloud, with a simple UI embedded right in your Grafana instance to manage alerts.
Building on this, we’ve given the Grafana alerting system a complete overhaul with 8.0, unifying Prometheus alerting and Grafana alerting in the same user interface for viewing and editing alerts. This provides a common experience around alerting for all Grafana users and data sources — whether you’re using the open source version or the Enterprise and Cloud stacks.
Both Grafana-managed alerts and alerts from Prometheus-compatible data sources are supported, so you can create and edit alerting rules for Grafana-managed alerts, Cortex alerts, and Loki alerts as well as see alerting information from Prometheus-compatible data sources in a single, searchable view. This is an opt-in feature for 8.0.

Alerts are now decoupled from dashboards, and we’ve added support for multi-dimensional alerts, notification policies to manage notifications at scale, and a full-featured API.
There’s supposed to be a video here, but for some reason there isn’t. Either we entered the id wrong (oops!), or Vimeo is down. If it’s the latter, we’d expect they’ll be back up and running soon. In the meantime, check out our blog!
For more on our new alerting feature, be sure to catch the “What’s next for alerting in Grafana” session at GrafanaCONline on June 16.
Value mappings
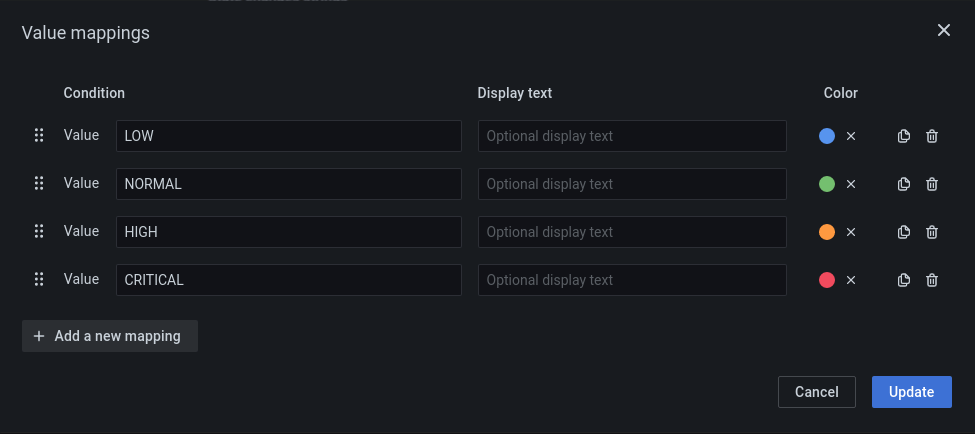
With the new value mappings editor, you can directly map strings and boolean states to colors and alternative display texts. This will work across all Grafana visualizations, including the new State timeline panel (see below).
State timeline panel
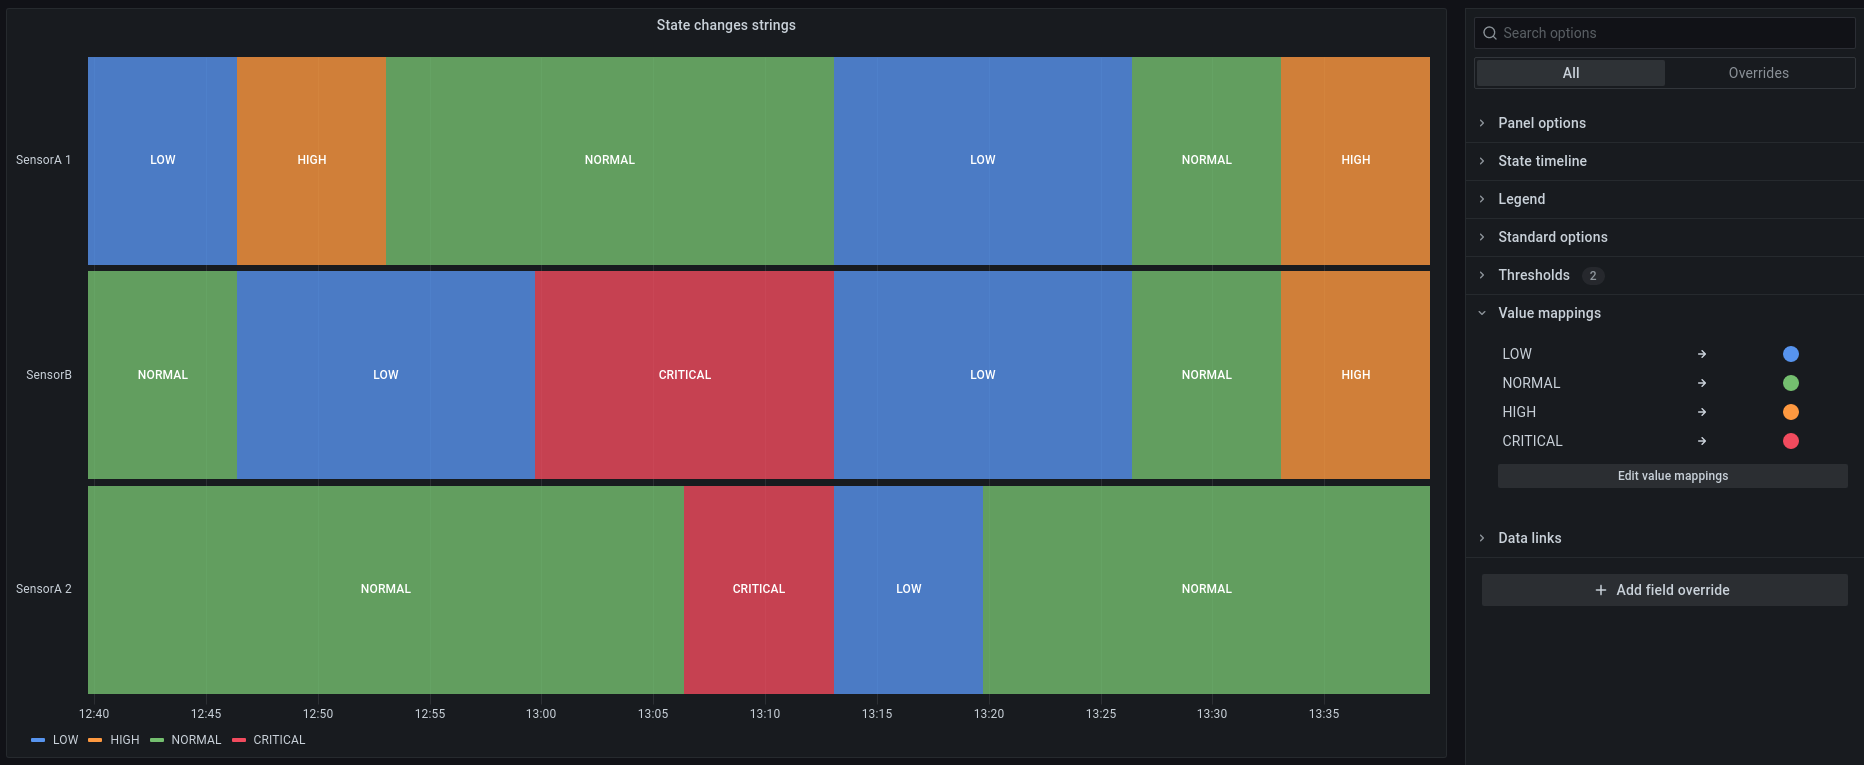
The State timeline panel can show string or boolean state over time. Using the new value mapping feature mentioned above, you can assign colors to each value. You can also visualize time series as discrete states over time by using thresholds, making it easy to see at a glance the duration spent in each threshold bracket.
Status history panel
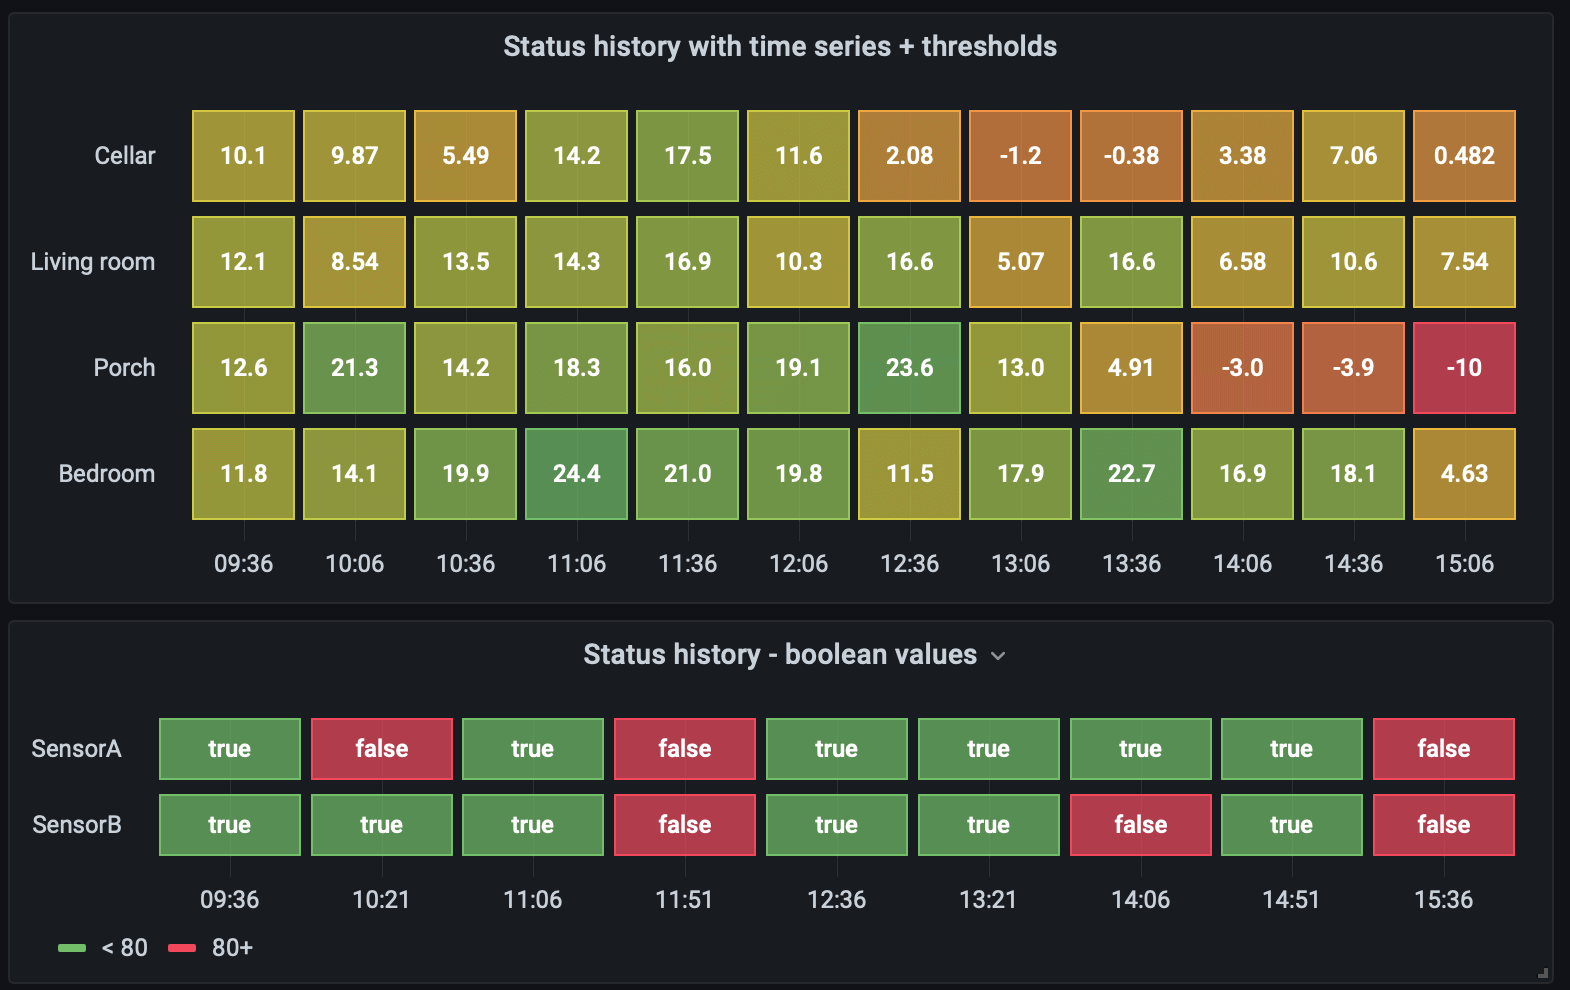
Designed to show a status lookback, this panel visualizes periodic data over time. You can add colors to each value using value mapping. This works with numerical, string, or boolean state.
Bar chart panel
A new Bar chart panel adds new graphing capabilities to Grafana, especially for non-time series data. It supports a categorical x or y field, grouped bars, and horizontal and vertical layouts.

Histogram panel
Once a hidden feature of the old Graph panel, this Histogram panel is now a standalone visualization. You can use this panel to combine a histogram transformation that calculates the buckets in the distribution of the data and a bar chart visualization. Additionally, we’ve introduced a histogram transformation that can be paired with any visualization.

Panel search and table toggle
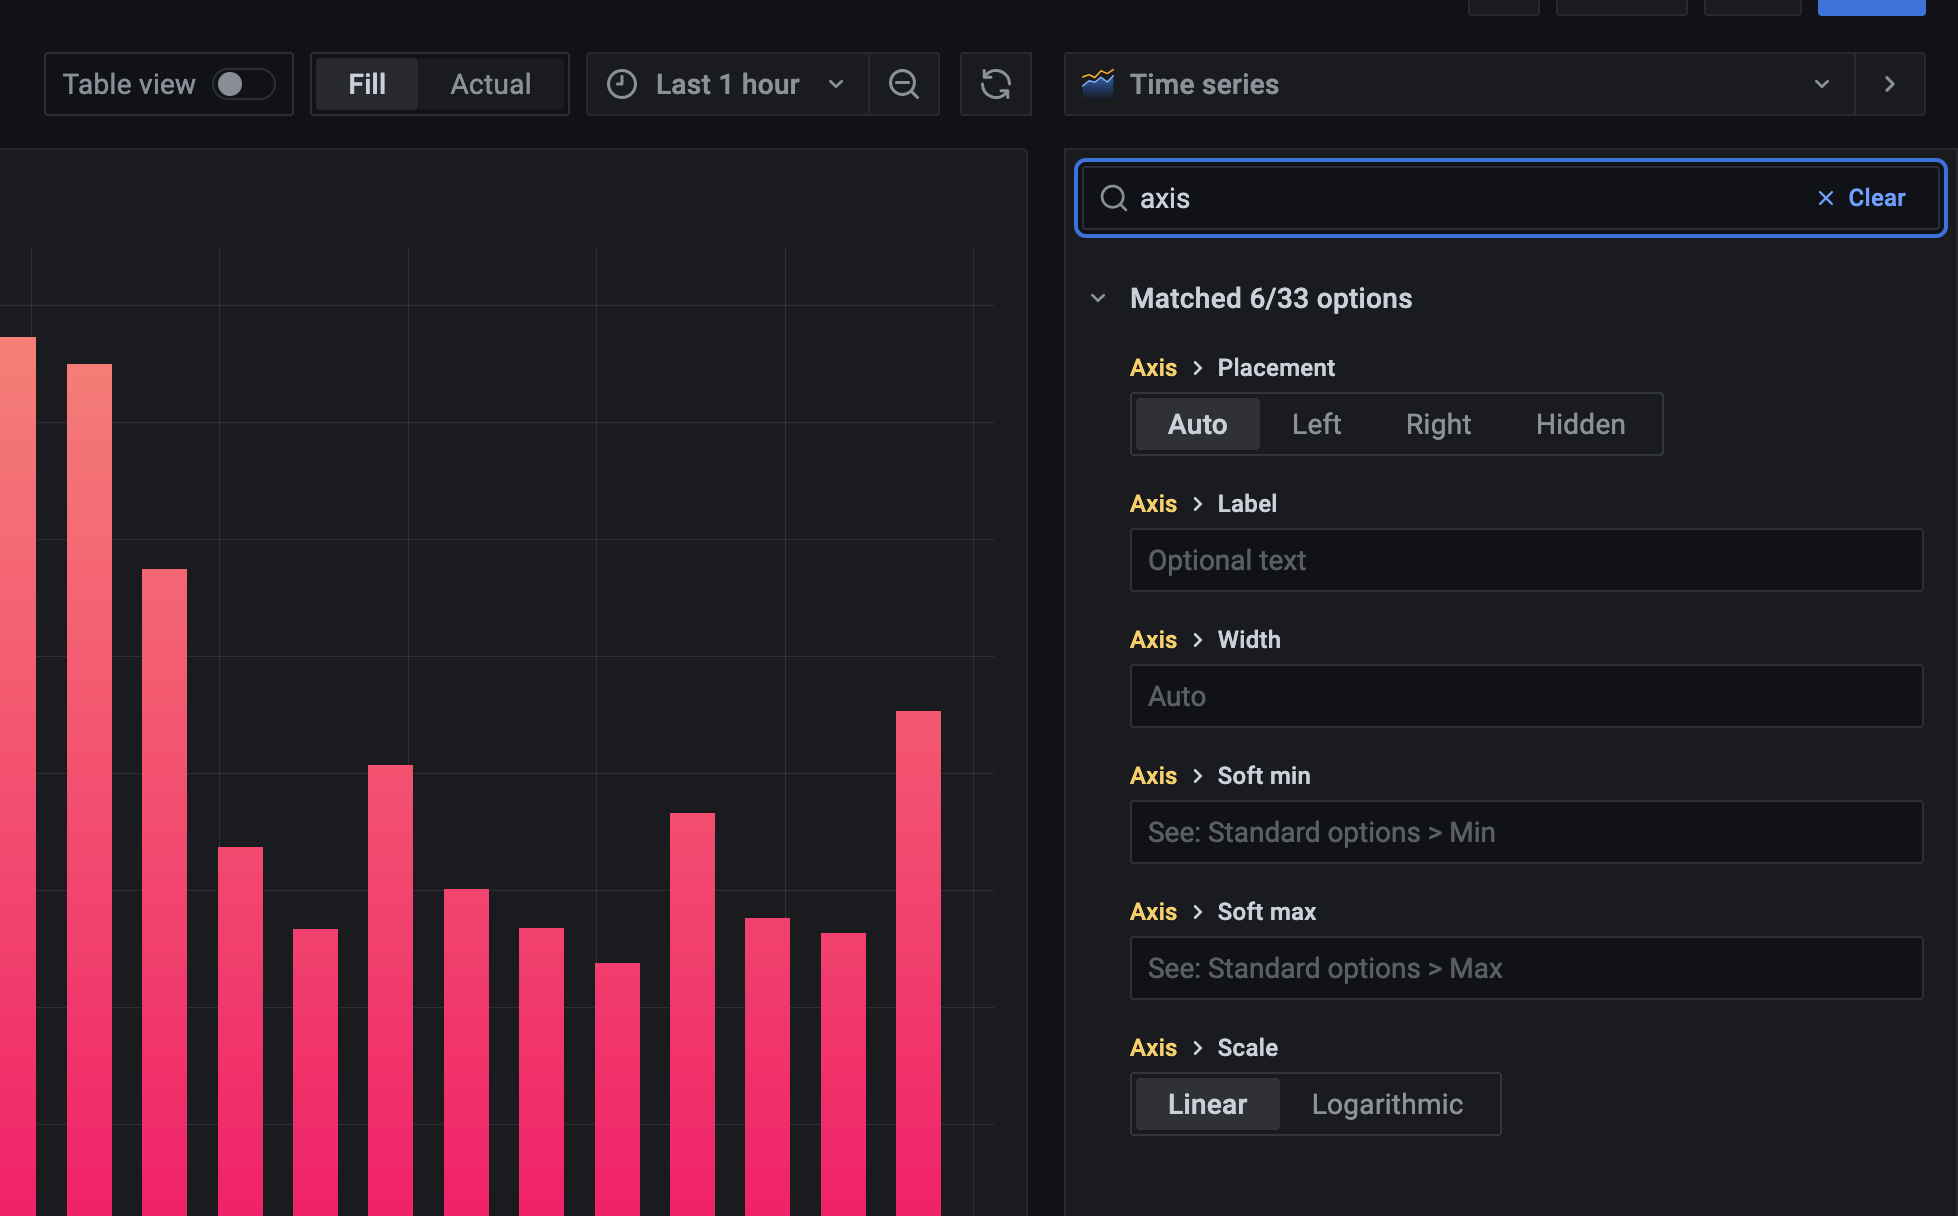
To improve navigation, we added search to make it easier to find what you want in the long list of panel options and overrides. They are also now all listed in the panel edit sidebar instead of being separated in tabs. Plus, there is a new table view toggle that allows you to quickly view the data being passed to the visualization.
Library panels
We’ve added a new workflow for reusing panels. You can now build library panels that can be shared across multiple dashboards. Changes or updates made to a library panel will be reflected on every dashboard where that library panel is used.
Real-time streaming
Previewed in the graph panel in the 7.4 release, real-time streaming gets more functionality in 8.0. It’s part of the exciting changes we’ve been making in Grafana to support industrial/IoT use cases. Live updates can now be sent to dashboards over a websocket connection with the MQTT data source or can be streamed from cURL or Telegraf. Events can also be sent to dashboards by posting metrics to the new live endpoint /api/live/push endpoint.
This is now a built-in, standard feature of Grafana that can be used out of the box. All you have to do is push to the API and hook up panels for the data you’re pushing.
There’s supposed to be a video here, but for some reason there isn’t. Either we entered the id wrong (oops!), or Vimeo is down. If it’s the latter, we’d expect they’ll be back up and running soon. In the meantime, check out our blog!
Improvements for logs
We made significant improvements to log navigation in Explore. We added pagination to logs, so you can click through to older or newer logs when you hit the line limit.

You can also download log results as a text file through the Data tab in the Panel inspector and Inspector in Explore.
More functionality for traces
You can now search for traces by querying Grafana Loki directly from Grafana Tempo, our distributed tracing backend that just became GA!
Using an attached Loki data source with logs, you can more easily discover traces with Tempo and quickly build a Loki query. Taking it one step further, the Tempo query panel can now provide help building queries from Loki data source logs without so you don’t have to be an expert in LogQL — all while providing a more unified trace discovery experience.
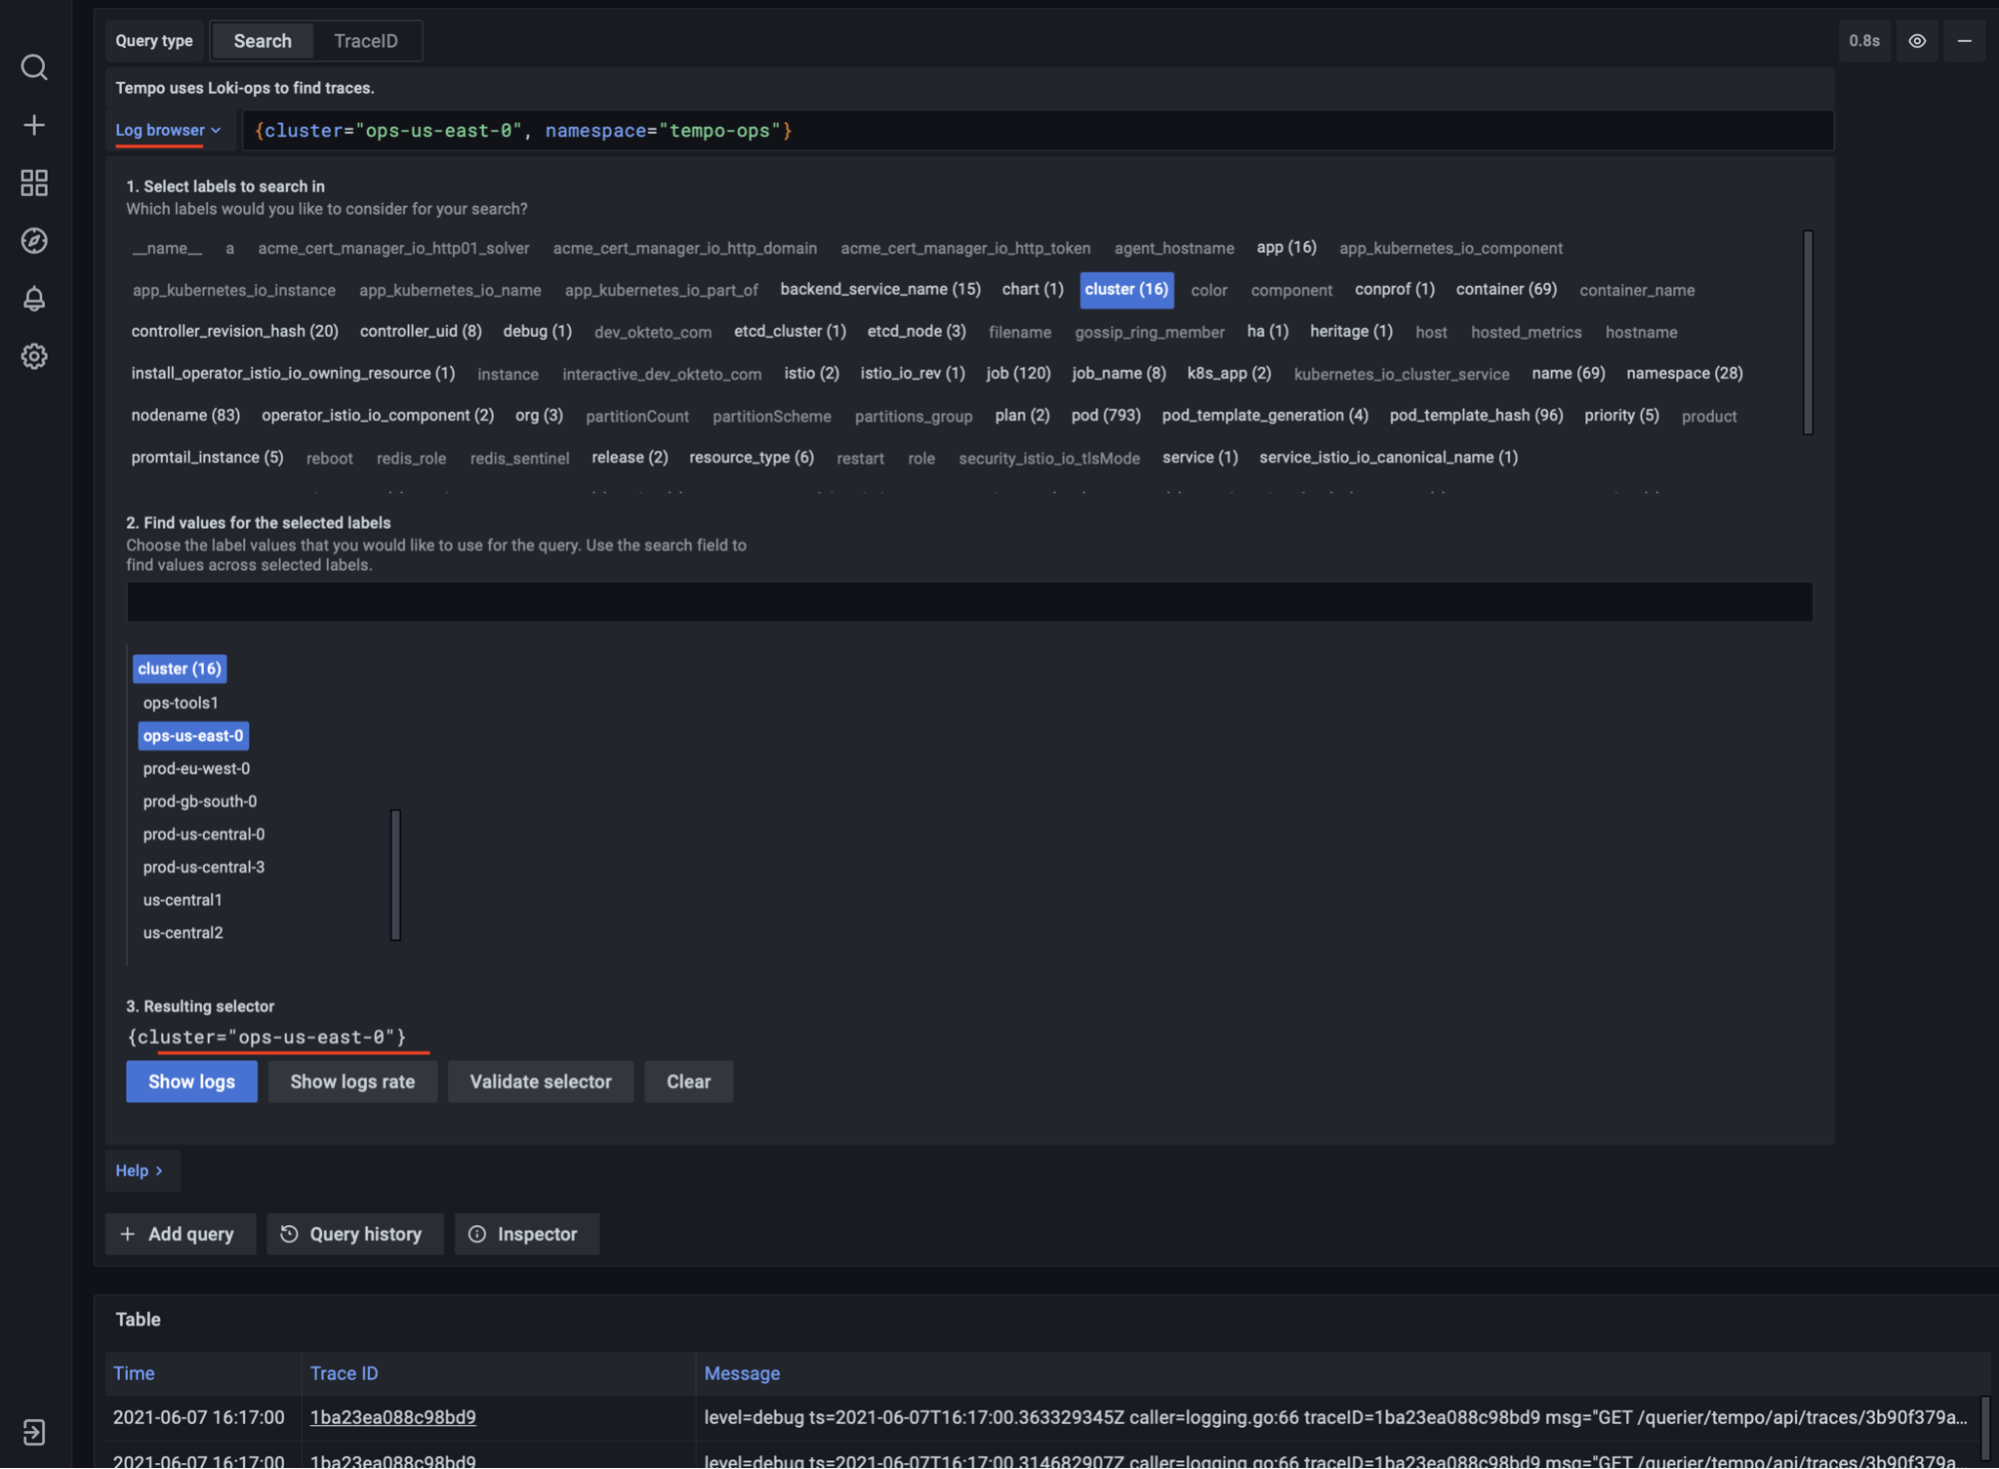
There’s also better Jaeger search in Explore, and a show trace graph that supports Jaeger, Zipkin, and Tempo.
Fine-grained access control in Grafana Enterprise
We often get requests from Grafana Enterprise customers for more specialized access control configurations; for instance, the ability to allow specific users or groups of users to have edit access for certain reports but only view access for others.
With 8.0, we’re adding permissions to anything that a user might want to control. Permissions are grouped by roles; we ship a few of these as fixed roles and also allow users to add their own roles. These roles can then be associated with a set of users. We’re starting with support for the built-in roles of viewer, editor, admin, and Grafana admin, but we’ll soon launch assigning roles to individual users and teams as well.
This feature is in beta, behind the access control feature toggle.
Data source query caching in Grafana Enterprise
To address pain points that customers have experienced with some data sources, we’ve added query caching. Grafana will now cache the results of backend data source queries for faster query performance and dashboard loading. Eliminating unnecessary duplicate queries also results in fewer API requests and lower costs.
Reporting in Grafana Enterprise
Enterprise users now have improved reporting capabilities: You can export table panels as .csv files and include live dashboard links in reporting emails to showcase your data live in Grafana.
Get more information
Check out the documentation and release notes for a complete list of new features, changes, and bug fixes.
Sign up for our upcoming live webinars to learn more about dashboarding and the Grafana 8 user interface while setting up monitoring for a web service that uses Prometheus and Loki to store metrics and logs.
June 24: Getting started with Grafana 8
June 29: Getting started with Grafana dashboard design
Upgrade Grafana
Download or try Grafana 8.0 in the cloud today.
Refer to Upgrading for more information about upgrading your Grafana installation.
Thanks
A big thanks to all the Grafana users who contributed by submitting PRs, bug reports, and feedback!


