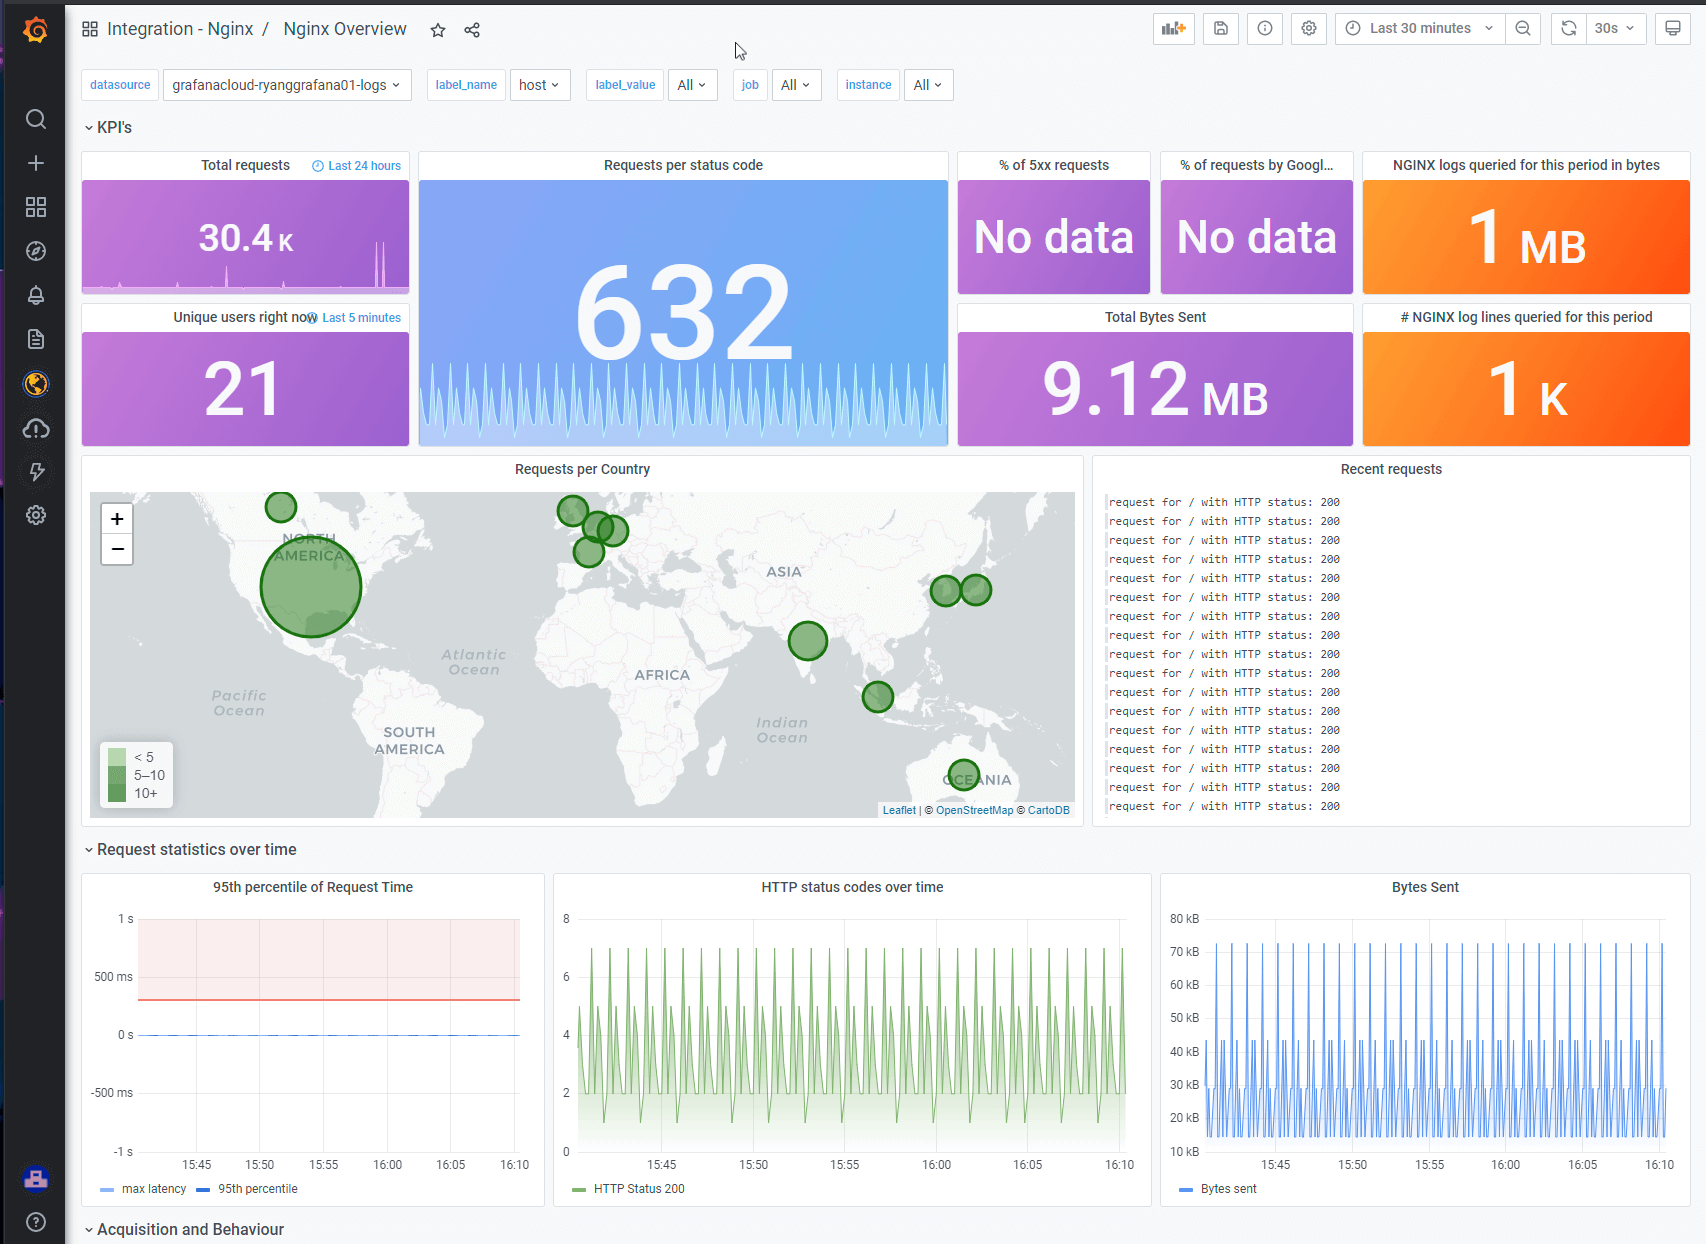
Monitor key metrics and visitor demographics in NGINX with the new Grafana Cloud integration
We are happy to announce that the NGINX integration is available for Grafana Cloud, our composable observability platform bringing together metrics, logs, and traces with Grafana.
Access logs visualized
This integration is the first that relies on the power of processing logs with Loki. By creating a custom JSON access log, you can easily visualize things like total traffic, error rates, unique visitors, and visitor demographics.

You can find detailed instructions on configuring the custom access log in the integration documentation. This access log doesn’t need to replace your existing ones; you can add it right alongside them.
Sandbox deployment
Don’t have an NGINX deployment that you can easily reconfigure? We’ve got you covered!
You can use this simple demo application, which will automatically stand up everything you need.
- NGINX Server on port 8000
- A sample HTML5 application
- GeoIP2 IP address geocoding
- Grafana Agent to ship the logs
Host this simple stack on a VPS or cloud provider of your choice, and point our Synthetic Monitoring at it to generate some worldwide traffic.
Get started
The native integration with NGINX is available now for Grafana Cloud users.
If you’re not already using Grafana Cloud, we have new free and paid plans to suit every use case — sign up for free now. It’s the easiest way to get started observing metrics, logs, traces, and dashboards.
For more information on monitoring on Grafana Cloud and NGINX, check out our docs or join the #integrations channel in the Grafana Community Slack.
Let us know what you think
Stay tuned for future content on how to best utilize the Grafana Cloud NGINX integration. And tell us what you’d like to see! You can chat with the Cloud Integrations team on our Community Slack.


