Visualize Humio logs alongside your other data sources in Grafana Cloud with the new plugin for Grafana
Being able to get the big picture and immediately pivot between siloed data is one of the key values Grafana Cloud provides. Our composable observability platform integrates Prometheus and Graphite metrics, Loki logs, and Tempo traces with Grafana — and also allows you to draw data in from other sources of your choice concurrently.
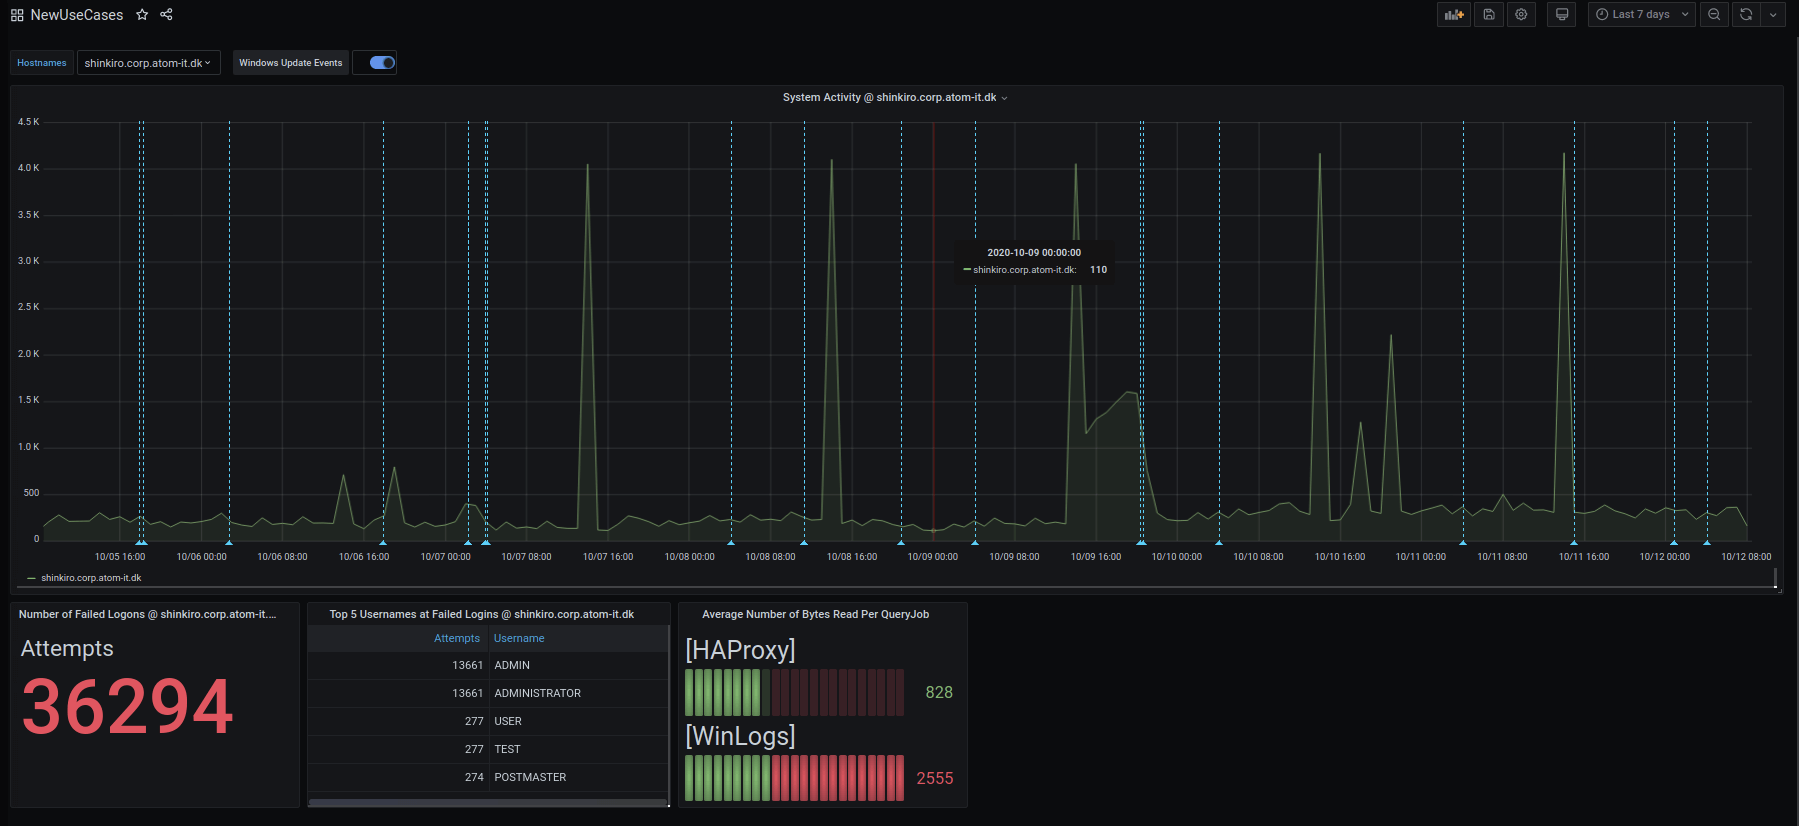
With the new Humio data source plugin for Grafana, you can add Humio log data to that list. Humio’s log management platform was purpose-built to give DevOps, ITOps, and security teams the ability to aggregate, search, alert on, and visualize large volumes of distributed data in real time. The integration with Grafana allows Humio users to easily create Grafana dashboards from Humio data (alongside any number of other data sources) to share across departments in order to resolve issues quickly.
Get started with Grafana Cloud
Grafana Cloud is the easiest way to get started observing metrics, logs, traces, and dashboards. When you sign up for a Grafana Cloud account, you get all the following for free, forever:
- 10,000 series for Prometheus or Graphite metrics
- 50GB of logs
- 500VUh of k6 testing
- 14-day retention for metrics and logs
- Synthetic monitoring
- Access for up to 3 team members
Included with your account is a 14-day free trial of Grafana Cloud Pro, which comes with additional storage limits, alongside a host of premium features with team collaboration in mind, like longer data retention, advanced authentication, reporting, and usage insights. After the 14 days are up, you can decide if you’d like to pay and continue using the upgraded Pro plan or be automatically converted to the free plan.
To sign up for a Grafana Cloud account:
- Navigate to https://grafana.com/products/cloud/
- Click Start for free on the banner.
- Follow the instructions to finish setting up your account and access the Cloud Portal.
Install the Humio plugin
The Grafana plugin library contains over 40 data source plugins for many popular data stores, cloud services, and applications, all with one-click installation into Grafana Cloud.
- In a web browser, navigate to the official Grafana Plugins page and find the Humio plugin.
- Click the plugin, and then click the Installation tab.
- On the Installation tab, in the For field, click the name of the Grafana instance that you want to install the plugin on.
Grafana Cloud handles the plugin installation automatically.
You can get more information about getting started with Grafana Cloud in the docs.
Humio + Grafana
While Humio has its own selection of customizable dashboards, Grafana provides a consistent set of data visualizations across your organization, and enables you to integrate your choices of technologies and tools with plugins. This can mean clarity and ease of understanding for business users who need to analyze and view dashboards from multiple sources.
Once the Humio plugin is installed, you can create any Grafana dashboards you want with all supported panel types and use the full range of the Humio query language to pull results from Humio for presentation in Grafana. All this can be done from within the Grafana interface.
The new plugin also supports the use of variables when writing the Humio queries, which makes it possible to create templates that save you time when you’re building multiple similar dashboard panels. Support for annotations allows the dashboards to include useful explanations of important events and data in a way that is easily understood by viewers not familiar with the data formats.

The DevOps and Security teams at Schibsted, a media group based in Norway, use Humio to provide log management for their applications and supporting infrastructure and have chosen Grafana as their standard dashboard tool across the entire business. The Humio platform team within Schibsted uses the Humio interface to conduct real-time searches and to create queries that will generate alerts when certain conditions are met and thresholds exceeded. However, when the team wants to provide summary dashboards to business users and applications owners, Grafana is the answer.
“As a business we see great value in using tools which interoperate, such as Humio and Grafana,” says Jeremy Banzhaf, Senior Site Reliability Engineer at Schibsted. “This lets us put all of our relevant dashboards in one place, giving our users a consistent look and feel which helps them quickly gain business insights from their logs, metrics, and other sources. With the new plugin, we can use all of our log data from Humio directly in Grafana, both as customized logs and as on-the-fly metrics. This enables Humio insights to be correlated with other data in a ‘single pane of glass,’ letting us turn data into information which our business users can see at a glance.”
Conclusion
If you’re already standardizing on Grafana for all of your business dashboards, this plugin allows you to seamlessly bring Humio into the set of tools and data sources that you can visualize within Grafana. Read more about the Humio data source plugin for Grafana on the plugin page.
And if you’re new to Grafana, check out Grafana Cloud, our fully composable observability stack for metrics, logs, and traces; and the self-managed Grafana Enterprise Stack tailored for large organizations with scale and secure metrics, logs, and Grafana on your own infrastructure. You can get started here.


