
Turn your home office into a NOC room with Philips Hue and Grafana
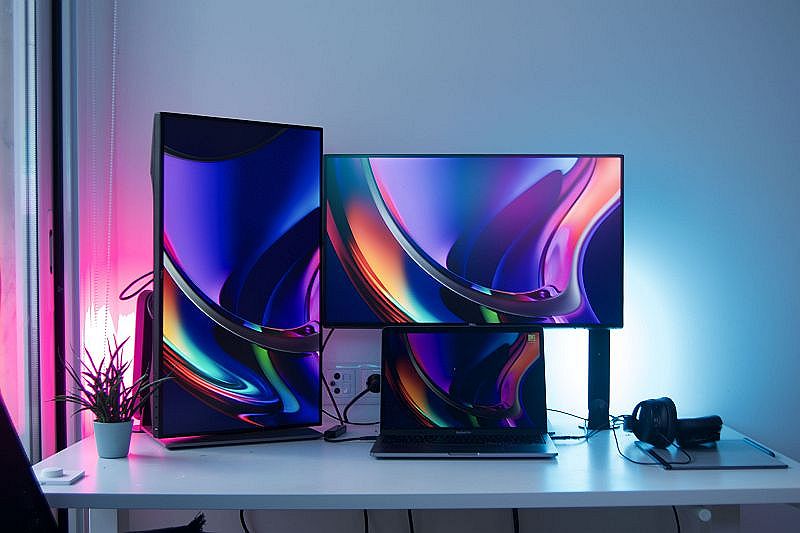
I recently got a couple of Philips Hue Play lights to spice up my home office setup, and after a bit of tinkering with the APIs, I decided it would be a fun project to create my own personal NOC room, using them to visualize the status of some system I’m monitoring.
How does it work?
Grafana comes with a few interesting notification capabilities, such as Pagerduty, Opsgenie, and webhook. We are going to use a webhook to “send information about a state change over HTTP to a custom endpoint.”
Upon receiving notifications, our webhook will communicate with our Hue Bridge. When it receives an alert notification, it will turn on the configured light group in a bright red. If it then receives an “OK” notification, it will change the color to a more reassuring green.
You can check out the webhook code at https://github.com/Elfo404/grafana-hue-notifier. It’s a simple node.js application that interacts with Philips Hue Bridge APIs.

For simplicity’s sake, we are going to use TestData DB. It’s a Grafana data source that generates random data, which is very convenient for testing purposes.
Quickstart using the Docker compose file
If you just want to give this a quick try, the repo contains a docker-compose.yml file that will spin up a local Grafana instance with the webhook and everything shown above already provisioned.
Before starting the container, make sure to create a .env file (you can copy .env.example) and replace the env variables with the one generated in the webhook setup instructions below.
Once you update the .env file, you can just run docker-compose up and everything should work.
Running Grafana on the same network as your Hue Bridge
This is the simpler way to get started. If you are already doing some home automation, chances are you are already running Grafana somewhere in your network.
Build the webhook Docker image
Clone https://github.com/Elfo404/grafana-hue-notifier and run docker build -t grafana-hue-notifier.
Webhook setup
Some of the Hue APIs require authentication. This involves pressing the big button on your Hue Bridge to generate a new user to use with the webhook.
The previously built image also contains a script to generate a user for you.
Press the Hue Bridge button and run docker run --net=host grafana-hue-notifier npm run setup.
The command will print to console the newly created user’s username and a list of light groups with their IDs. Here’s an example:

You can now run the webhook with PORT=3001 HUE_USERNAME=<username> HUE_GROUP_ID=<your-hue-group-id> docker run --net=host grafana-hue-notifier.
Notification channel setup
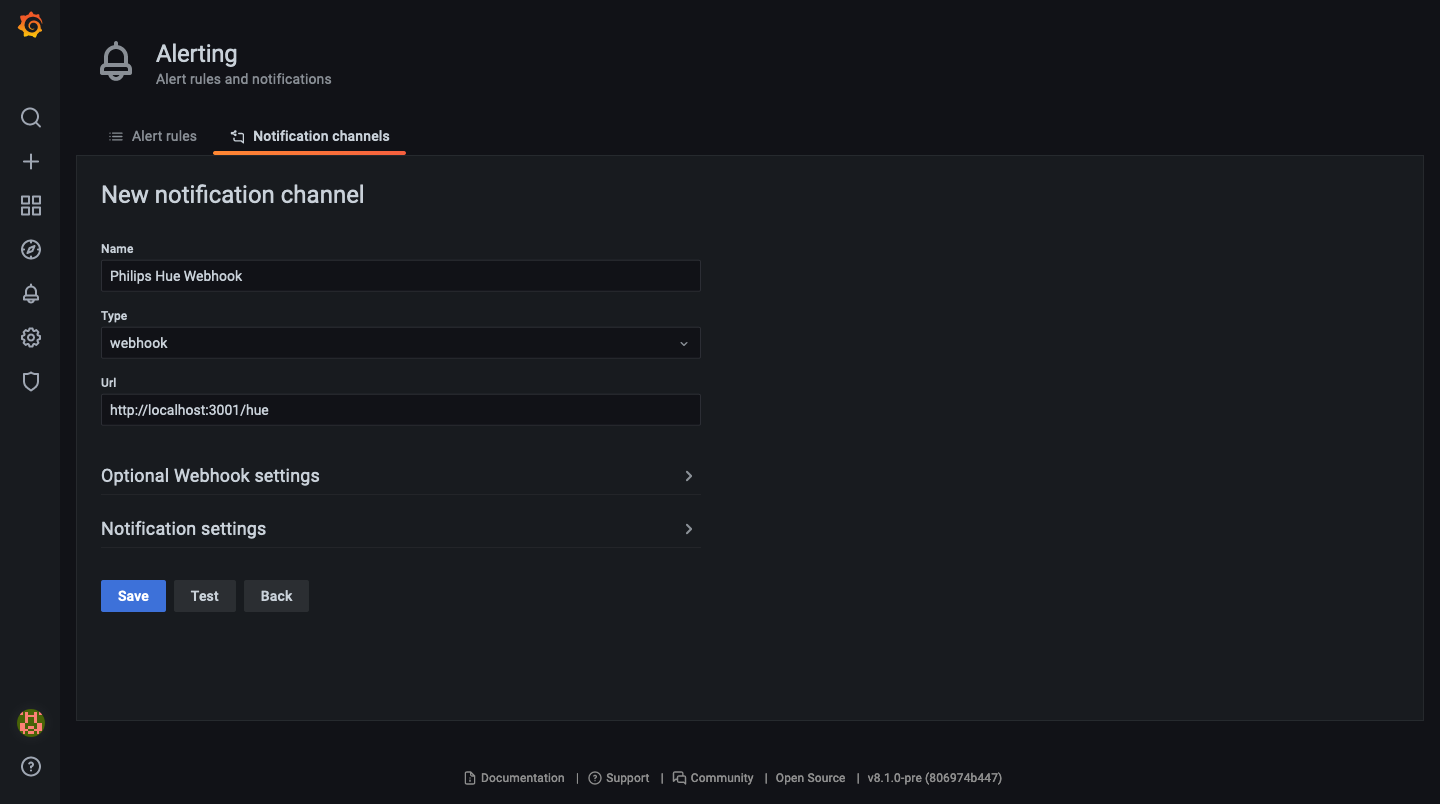
The first thing we need to do is to create a notification channel in Grafana that will send status updates to our webhook.
Pick whatever name you might want to assign to the channel, choose Webhook in the Type select, and set the URL on which the webhook will listen: http://localhost:3001/hue.
Data source and alert setup
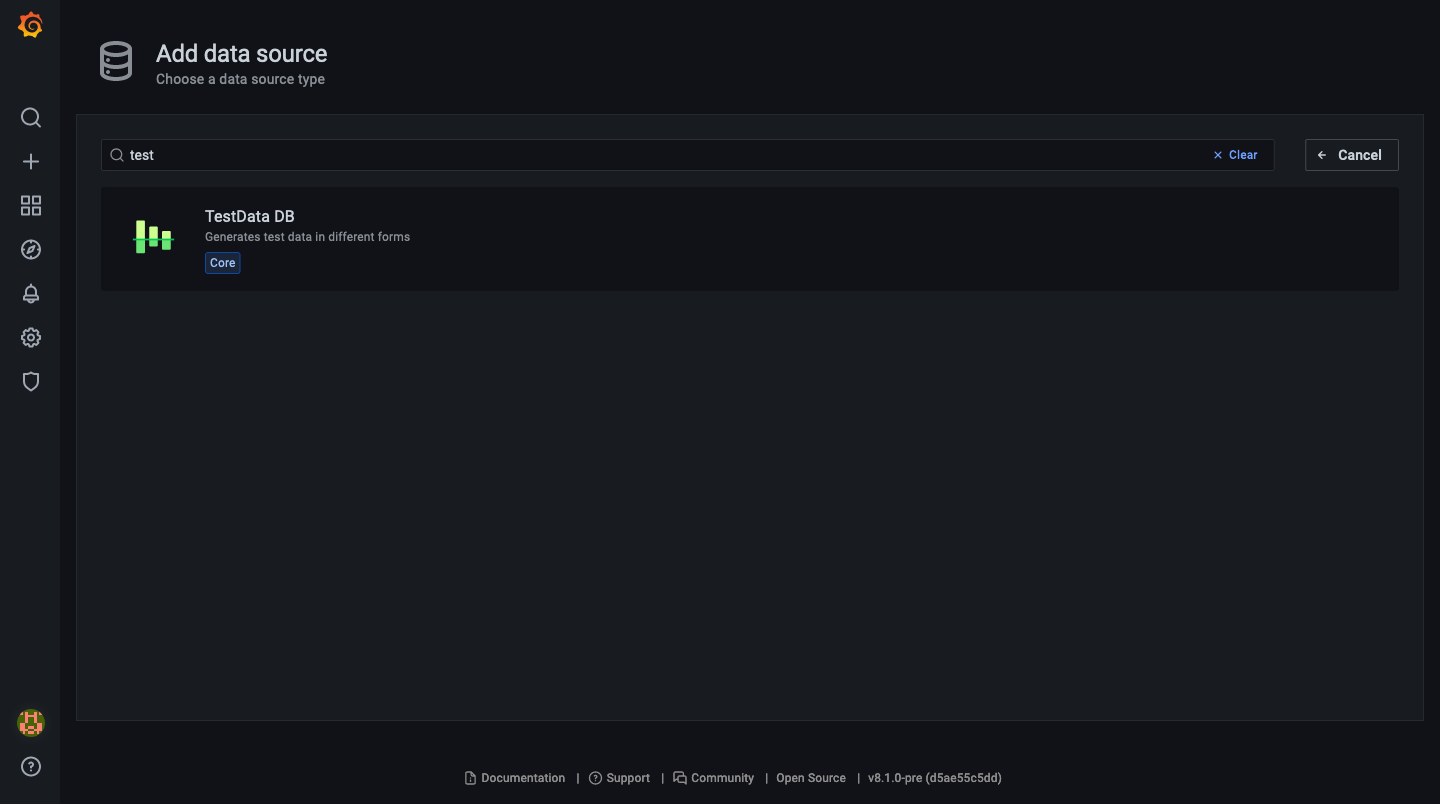
As mentioned above, we are going to use TestData DB to keep things simple, but the webhook will work with any data source that supports alerting, so feel free to pick the one that better suits your needs.
Go to Configuration -> Data sources -> Add Data source, pick TestData DB, give it a name, and click Save.
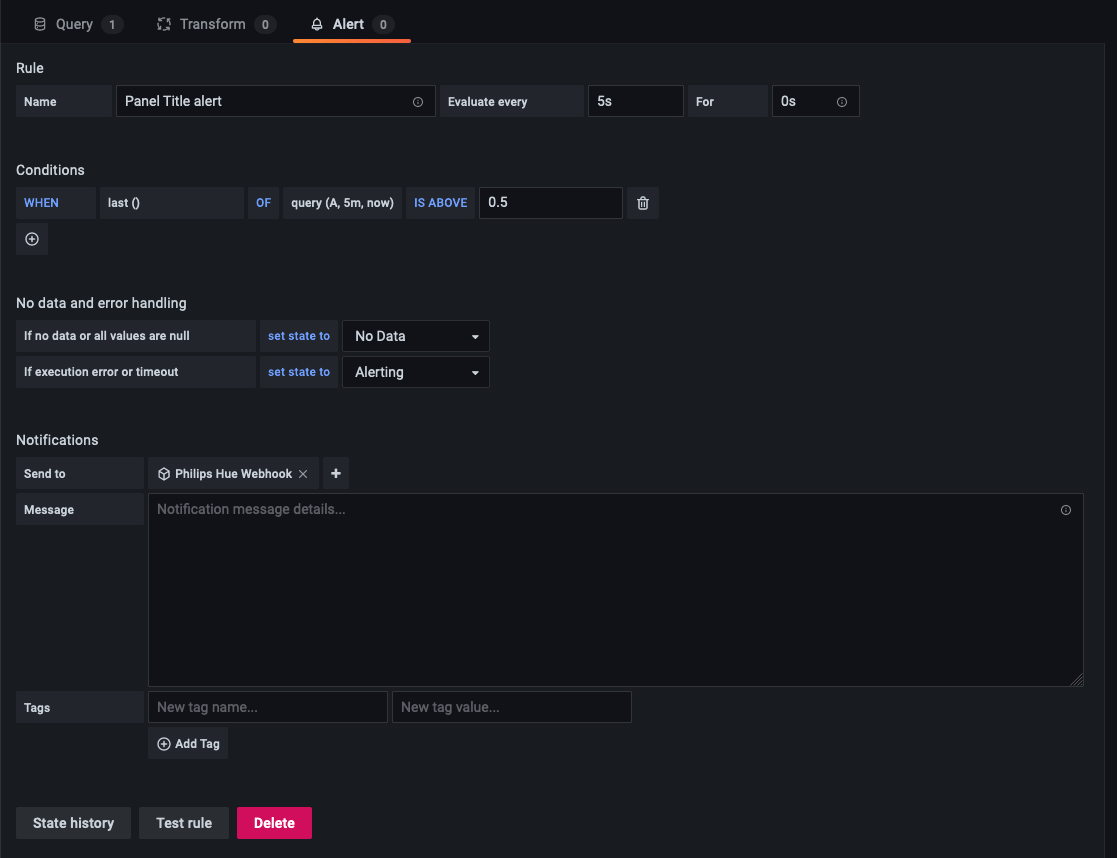
Let’s now create a new panel in a dashboard and an alert using the notification channel that we created before. For this example, we are using a predictable pulse that changes state every 30 seconds:

For this demo, we’ll evaluate the alert rule every 5 seconds, and we’ll set For to 0s.
This value indicates how long Grafana should keep evaluating the configured alert rule before sending a notification. By setting it to 0s, we skip the “pending” state.
🎉 Ta-daa!
We now should have everything running!

The alert rule we just created will evaluate every 5 seconds, and as soon as the alert goes in “alerting” state, Grafana will call our webhook and we should start seeing our lights turn on and change color to a bright red.
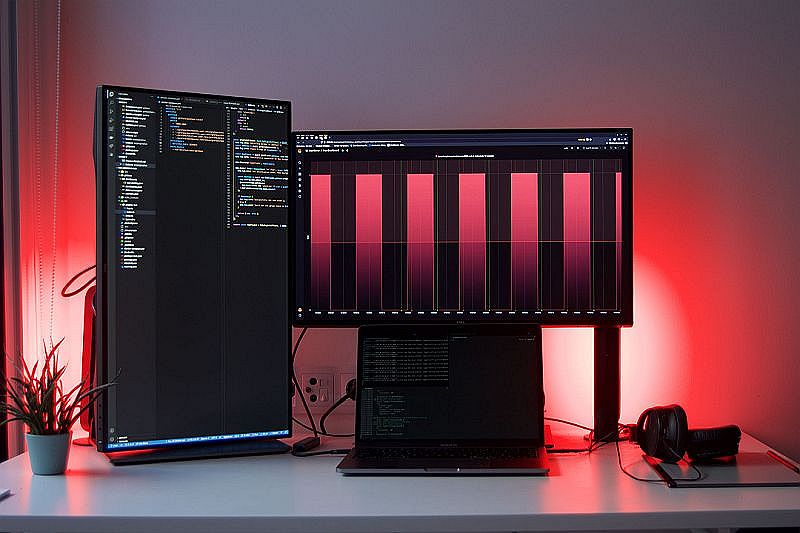
Note that the lights will only turn on if the notification state is “alerting,” as I’m ready to bet no one enjoys receiving a call at 3 a.m. saying “Hey! Everything’s fine here!”
The easiest way to get started with Grafana and observability is with Grafana Cloud, and we have free and paid plans to suit every use case. If you’re not already using Grafana Cloud, sign up today for free.


