What's new in the updated Strava plugin for Grafana
Grafana dashboards are often used to monitor a company’s metrics, but what about using them to monitor yourself?
That was the thinking behind our creation of the Strava plugin back in early 2020. Strava is a service that allows athletes to track and analyze their workouts and training sessions. It’s widely used for activities such as running and cycling. During a workout or training session, the application collects various data (GPS tracking, speed, heart rate, and more) then sends it to Strava for processing. Afterward, you can analyze your performance and compare or share results with other people — and the metrics are perfect to visualize in a Grafana dashboard.
The original version of the Strava plugin had limited query options, but we’ve changed that. The recently released 1.3.0 update comes with a bunch of new features that make it possible (and easy!) to pull out specific stats and data and visualize them in graphs and tables.
Here are some off some of the highlights:
The plugin now offers more query options and supports fetching data for a particular activity (such as run, ride, or other).
You can also select from the graph menu to fetch time series data for parameters such as heart rate, speed/pace, altitude, power, and cadence. The Fit to Range toggle helps to align your graphs with the current time range, making it easier to build reusable dashboards.

Here are two examples of graphs that visualize heart rate fluctuations during a workout.

This heart rate graph was made fetching splits created by Strava. You could also fetch data to create similar graphs for speed or pace — or whatever you need — and split it by standard intervals (usually 1 km).

With a stats query, you can create a panel that shows different stats (such as activity name, time, average heart rate, and more) as a single value. This is a great way to quickly reference data from a particular training session.

Combine everything together, and you’ll have a dashboard with detailed analytics of a specific activity, all visible in one place.

The updated Strava plugin also offers template variables support, which is another key to building a reusable dashboard. You’re able to fetch a list of activities from Strava, then use variables in the activity query. The activity can be filtered by type, too.

We’ve also added extended stats for the table view, so within the stats selector you’ll be able to select data such as average speed, elevation, and average watts, and more.

And here’s how those stats are then visualized in a table with extended stats (and defaults):

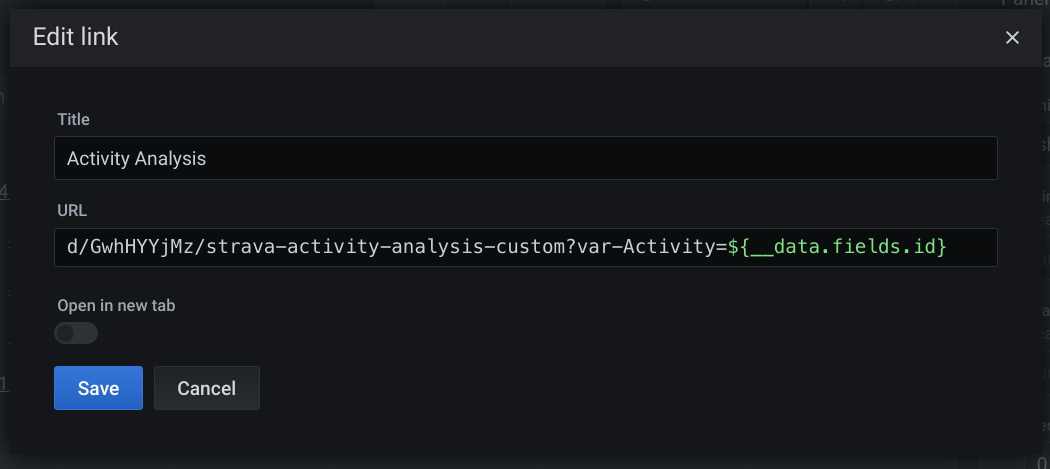
The table view above can also be used to navigate to the activity dashboard thanks to the newly added data links support. Just add a data link with the dashboard url and use ${__data.fields.id} as the activity variable value.
For example: d/GwhHYYjMz/strava-activity-analysis-custom?var-Activity=${__data.fields.id}

And if that’s not enough, several dashboards are included in the updated plugin (see below), so all you need to do is simply import it and enjoy — no sweat at all.

Happy exercising!
The easiest way to get started with Grafana and plugins is Grafana Cloud. We’ve added a generous free plan and upgraded our paid plans. If you’re not already using Grafana Cloud, sign up today for free and see which plan meets your use case.


