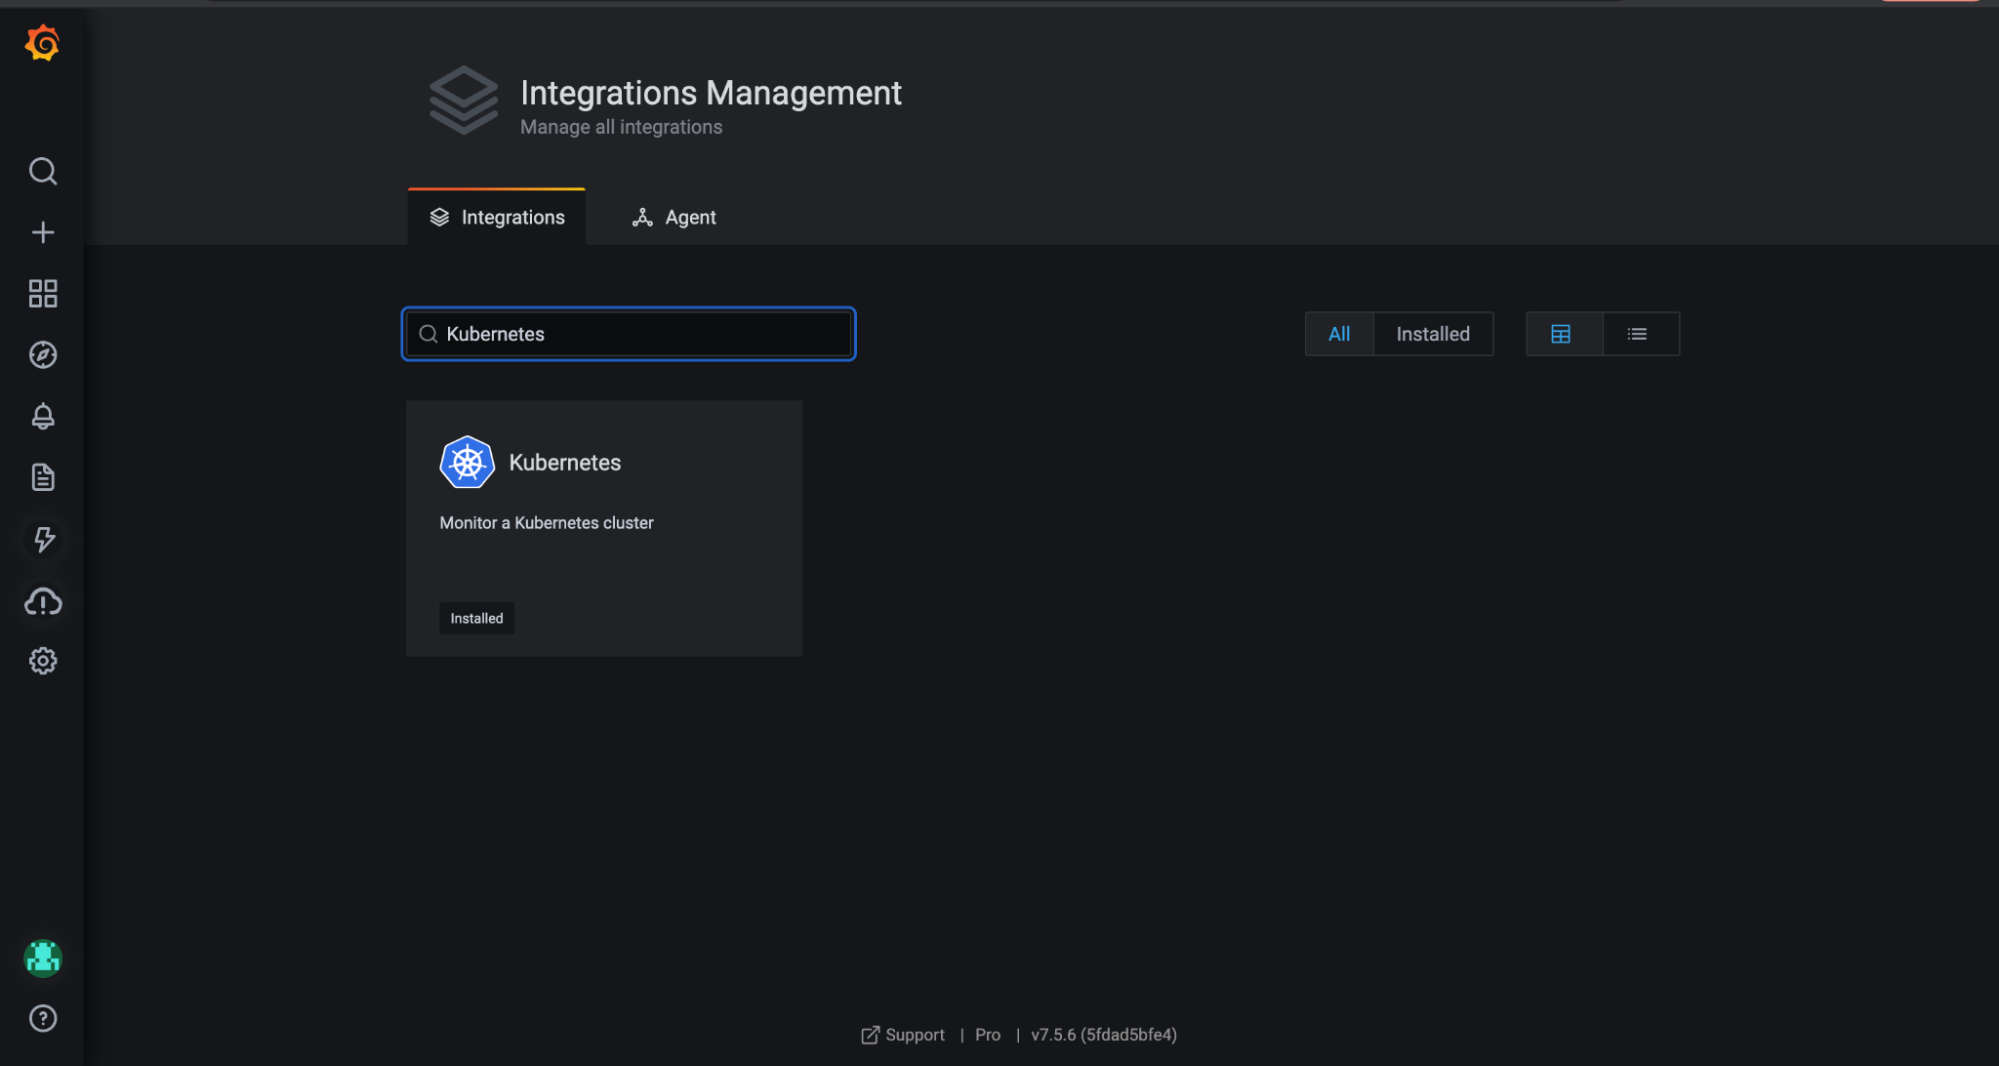
Easily monitor and alert on your Kubernetes clusters with the new Grafana Cloud integration
Today we’re excited to introduce the Kubernetes integration for Grafana Cloud, our composable observability platform bringing together metrics, logs, and traces with Grafana. Grafana Cloud users can now easily monitor and alert on core Kubernetes cluster metrics using the Grafana Agent, our lightweight observability data collector optimized for sending metric, log, and trace data to Grafana Cloud.

Built for simplicity
Previously, setting up Kubernetes monitoring with Grafana Cloud involved using Prometheus Operator or the Grafana Agent with a tedious custom configuration and deployment procedure. This involved configuring scrape endpoints like kubelet and cadvisor, which is both time-consuming and error-prone. So we wanted to make this easier.

That’s where our Kubernetes integration comes in. With just a few clicks, it allows you to:
- Quickly deploy into your cluster a pre-configured Grafana Agent that will scrape
cadvisorandkubeletendpoints. - Monitor and alert on cluster, namespace, pod, and container metrics like network bandwidth, CPU usage, memory usage, and more.
- Monitor and alert on kubelet metrics such as operation rates and node CPU and memory usage.
- Monitor and alert on persistent volume metrics such as disk and inode usage.
- Use multi-cluster views to visualize these metrics.
- Use six pre-configured dashboards and one recording rule.

Get started!
The native integration with Kubernetes is available now for Grafana Cloud users.
If you’re not already using Grafana Cloud, we have new free and paid plans to suit every use case — sign up for free now. It’s the easiest way to get started observing metrics, logs, traces, and dashboards.
For more information about the Kubernetes integration for Grafana Cloud, check out our Kubernetes integration docs and our Kubernetes solutions page, which has all the latest updates and content about the integration.
Let us know what you think
Tell us what you’d like to see in the Kubernetes integration! You can chat with the Cloud Integrations team on the #integrations channel in the Grafana Labs Community Slack.
Grafana Cloud is the easiest way to get started with metrics, logs, traces, and dashboards. We have a generous free forever tier and plans for every use case. Sign up for free now!


