How to correlate Graphite metrics and Loki logs
Grafana Explore makes correlating metrics and logs easy. Prometheus queries are automatically transformed into Loki queries. And we will be extending this feature in Grafana 8.0 to support smooth logs correlation not only from Prometheus, but also from Graphite metrics.
Prometheus and Loki have almost the same query syntax, so transforming between them is very natural. However, Graphite syntax for queries is different, and in order to map it to Loki, some extra setup is required. It sounds simple: You just need to decide what part of Graphite metric names should become Loki label values.
A little confused? Let’s have a look at an example.
Below are Graphite metrics to measure the total number of requests handled by each of two applications, both deployed into two different environments (test and production):
apps.prod.application1.requests.count
apps.prod.application2.requests.count
apps.test.application1.requests.count
apps.test.application2.requests.count
Graphite metric names are organized in hierarchical structures. Names are split into parts, also known as “nodes." Nodes are separated by a full stop (“.”).
Some nodes may represent a namespace for a group of monitored items (e.g. apps) or a specific part of the system (e.g. application1, application2). Nodes at the end of the metric name usually define what is being measured (e.g. requests.count).
This is just an example. Graphite metric names are very flexible and can follow different conventions. If you’re interested in best practices for how Graphite metrics can be organized, please take a look at Graphite’s documentation.
In the example above, there are 5 nodes in each metric name:
apps- a namespace for metrics related to all applicationsprod,test- the name of the environmentapplication1,application2- a unique identifier of an applicationrequests- what is being measuredcount- the value of the measurement. In the example, it’s the total number of requests for a given environment and an application, but it could also be used to track mean, median, or percentile values
Metrics tell just part of the story. Applications (application1 and application2) produce logs giving more insight into metric values. Let’s assume application logs are collected by Loki using labels to store metadata. For example:
{environment="prod", application="application2"} Request handled!
Notice how labels are closely related to unique names from Graphite metric nodes. Label values (like prod and application1) are also part of Graphite metric names. However, label names (environment and application) are not part of the metric name, but part of the chosen convention.
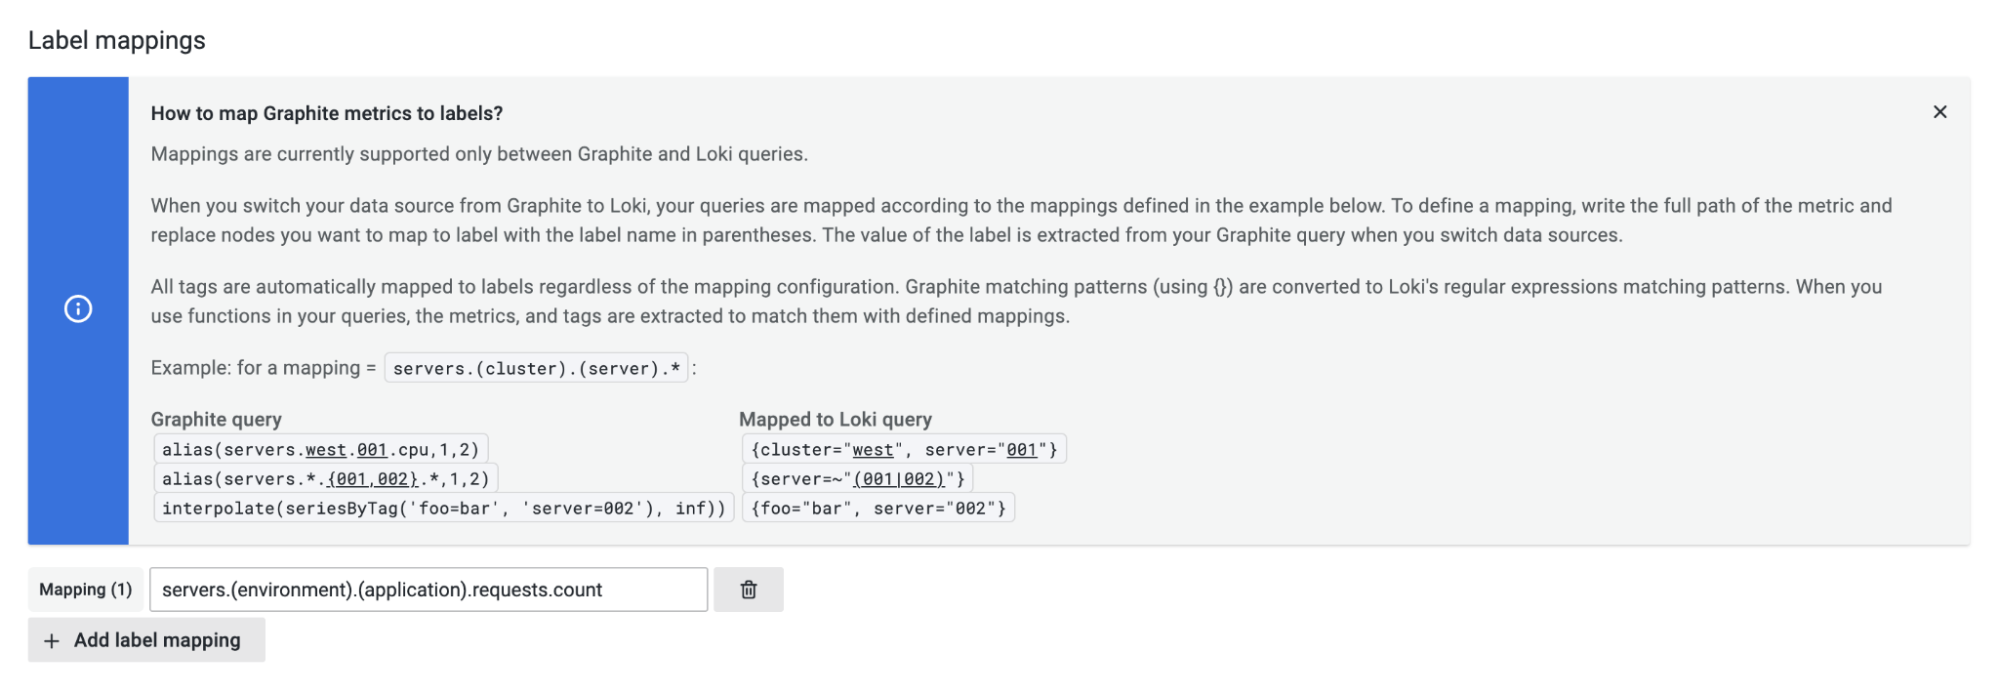
So how do you let Loki know about that convention to correctly match label names with values coming from a Graphite query? This information is added in the Graphite data source configuration in the label mappings section:

A mapping defines which node of a Graphite query is captured as a label value. The node is replaced with a label name in parentheses. When the data source changes from Graphite to Loki, label names from the mapping are matched with label values extracted from the query as in the example below:
- Mapping:
apps.(environment).(application).requests.count - Graphite Query:
apps.prod.application1.requests.count - Loki Query:
{environment="prod", application="application1"}
Graphite queries may contain functions, but they are not included in the mapping configuration. The metric path is extracted from the query by skipping functions, for example:
movingAverage(aliasByNode(apps.prod.application1.requests.count, 1, 2), 10) → apps.prod.application1.requests.count
That’s all! It’s even easier with Graphite tags. Queries with tags contain the name and the value at the same time allowing Graphite query to be transformed to Loki without any extra mapping configuration. For example:
- Graphite query:
seriesByTag("environment=prod", "application=application1") - Loki query:
{environment="prod", application="application1"}
Stayed tuned for more features democratizing metrics! And if you want to get started with Grafana, Graphite, and Loki, check out Grafana Cloud. We have free and paid Grafana Cloud plans to suit every use case — sign up for free now.
Plus, to learn more about the exciting new features in the upcoming release of Grafana 8.0 — not to mention have access to over 30 sessions featuring 70 different presenters from around the world — register for GrafanaCONline, which will take place June 7-17.


