Get started with distributed tracing and Grafana Tempo using foobar, a demo written in Python
Daniel is a Site Reliability Engineer at k6.io. He’s especially interested in observability, distributed systems, and open source. During his free time, he helps maintain Grafana Tempo, an easy-to-use, high-scale distributed tracing backend.
Distributed tracing is a way to track the path of requests through the application. It’s especially useful when you’re working on a microservice architecture. But getting started with it can be hard: You have to instrument your services, ingest the tracing data, store all your traces somewhere, pick a trace discovery method, and pray that everything works together. Also, you have to explain to the rest of your team how this new thing works, and how to use it effectively.
That’s why I built foobar, a small microservices application written in Python that contains all the things that you need to get started with distributed tracing.
In this blog post, we’ll experiment with foobar and troubleshoot some (totally) unexpected problems.
Getting started
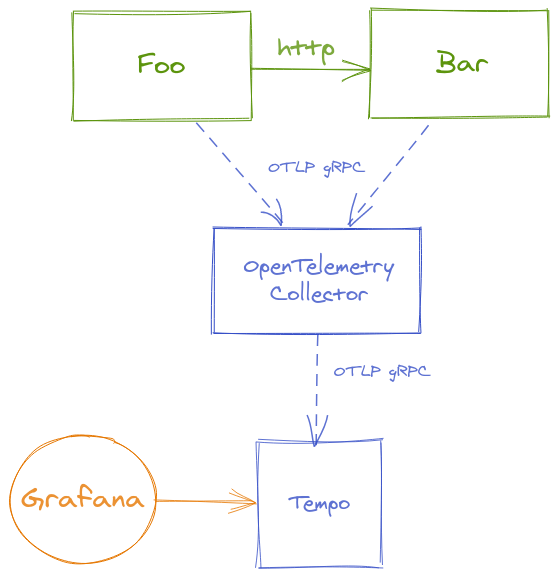
The foobar demo consists of two extremely complex services: foo and bar.
Both services are written in Python, are instrumented with OpenTelemetry, and use the OTLP gRPC Exporter to ship the traces to an OpenTelemetry Collector. This Collector exports the traces to Grafana Tempo, and we can query our tracing data from Grafana using the Tempo data source.

Running locally
If you want to follow along, make sure you have Docker and Docker Compose installed.
Let’s start by cloning the repo with:
➜ git clone https://github.com/dgzlopes/foobar-demo; cd foobar-demo
And then we’ll get the whole setup up and running with:
➜ docker-compose up --build -d
# (this is going to take some minutes)
That’s it! We have all we need. Now we have to check that foobar is up and working well. Here are two ways we can do this:
- With Curl: Run
curl http://localhost:5000/foo - With your Browser: Go to
http://localhost:5000/foo
Either way, the response should be the same: foobar. Ha!
Finding some traces
This is a tracing tutorial after all, right? Let’s find some traces.
Right now, the only way to look up traces on Tempo is by knowing the trace_id, a unique ID that each trace has. We’re going to query the logs of the foo service using the Docker Compose CLI, and then we’ll use grep to find the trace_ids:
➜ docker-compose logs foo | grep trace_id
foo_1             | time="2021-04-18 09:08:26,543" service=foo level=INFO addr="172.19.0.1" method=GET scheme=http path="/foo?" status=200 trace_id=5ac85e3e517f7ff62ac5aaaacccfabe8
foo_1             | time="2021-04-18 09:08:26,545" service=foo level=INFO addr="172.19.0.1" method=GET scheme=http path="/foo?" status=200 trace_id=9e38679e1782a593eb60c3375496467b
foo_1             | time="2021-04-18 09:08:26,545" service=foo level=INFO addr="172.19.0.1" method=GET scheme=http path="/foo?" status=200 trace_id=61b93a71bf42369c988930847ba12381
Pick one of them, go to Grafana (http://localhost:3000) -> Explore -> Tempo, paste the trace_id, and click on Run Query. You should see the full trace displayed on your screen!

Going further
We checked with Curl (and/or with the browser) that foobar was working, but that’s not enough. We should run a smoke test.
Smoke testing
A smoke test is a regular load test, configured for minimal load that is useful to run when you want to verify that your system doesn’t throw any errors when under minimal load.
To run the smoke test, we’re going to use k6, an open source load-testing tool that lets us create tests as code using JavaScript. This is what our test looks like:
import http from 'k6/http';
import { check, sleep } from 'k6';

export let options = {
    vus: 5,
    duration: '20s',
};

export default function () {
    let res = http.get('http://foo:5000/foo');
    check(res, {
        'is status 200': (r) => r.status === 200,
        'returns foobar': (r) => r.body == "foobar",
    });
    sleep(1);
}
This test is going to run with 5 virtual users for 20 seconds, and it’s going to make HTTP GET requests to our foo endpoint. Also, it’s going to check that the response status is 200 and that the body is foobar.
To run the test, we’re going to use the k6 Docker image:
docker run -i --network=foobar-demo_default grafana/k6 run --quiet - <example.js

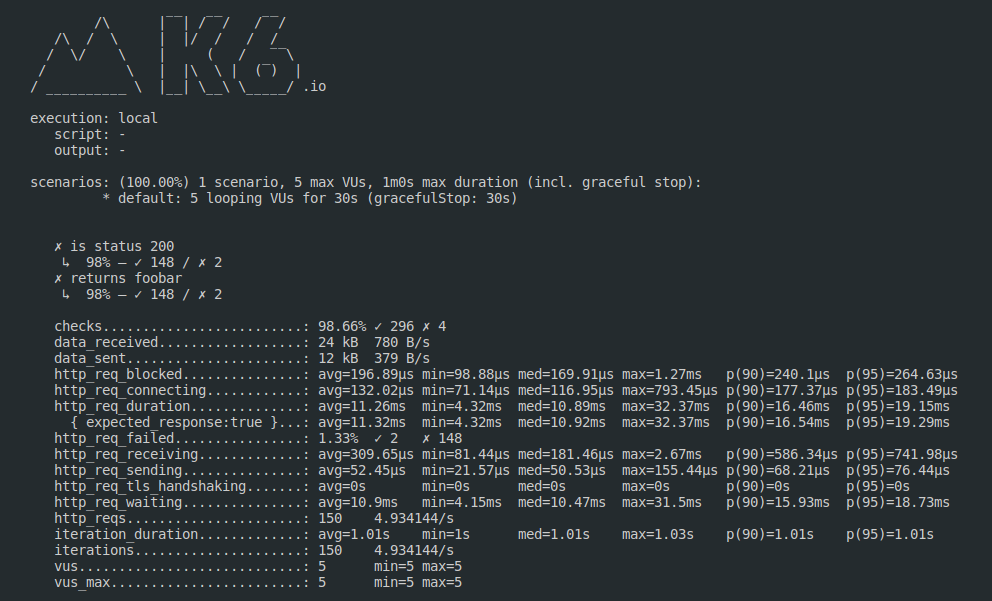
Once the test is finished, k6 gives us a summary of what happened during the test run, and we can see something… unexpected. Some checks failed! Yikes.
Troubleshooting
Let’s keep calm and try to understand what’s happening.
We know that sometimes the status code isn’t 200, right? Then we can go to the logs for the foo service, and with grep find the ones that match the outlier requests (status!=200):
➜  docker-compose logs foo | grep trace_id | grep -v status=200
foo_1             | time="2021-04-18 10:28:11,142" service=foo level=INFO addr="172.19.0.7" method=GET scheme=http path="/foo?" status=500 trace_id=b9e61bb959353927062acf99ed0b2de2
foo_1             | time="2021-04-18 10:28:16,233" service=foo level=INFO addr="172.19.0.7" method=GET scheme=http path="/foo?" status=500 trace_id=ae6ed04f4aa4244065fb04955fdcc9af
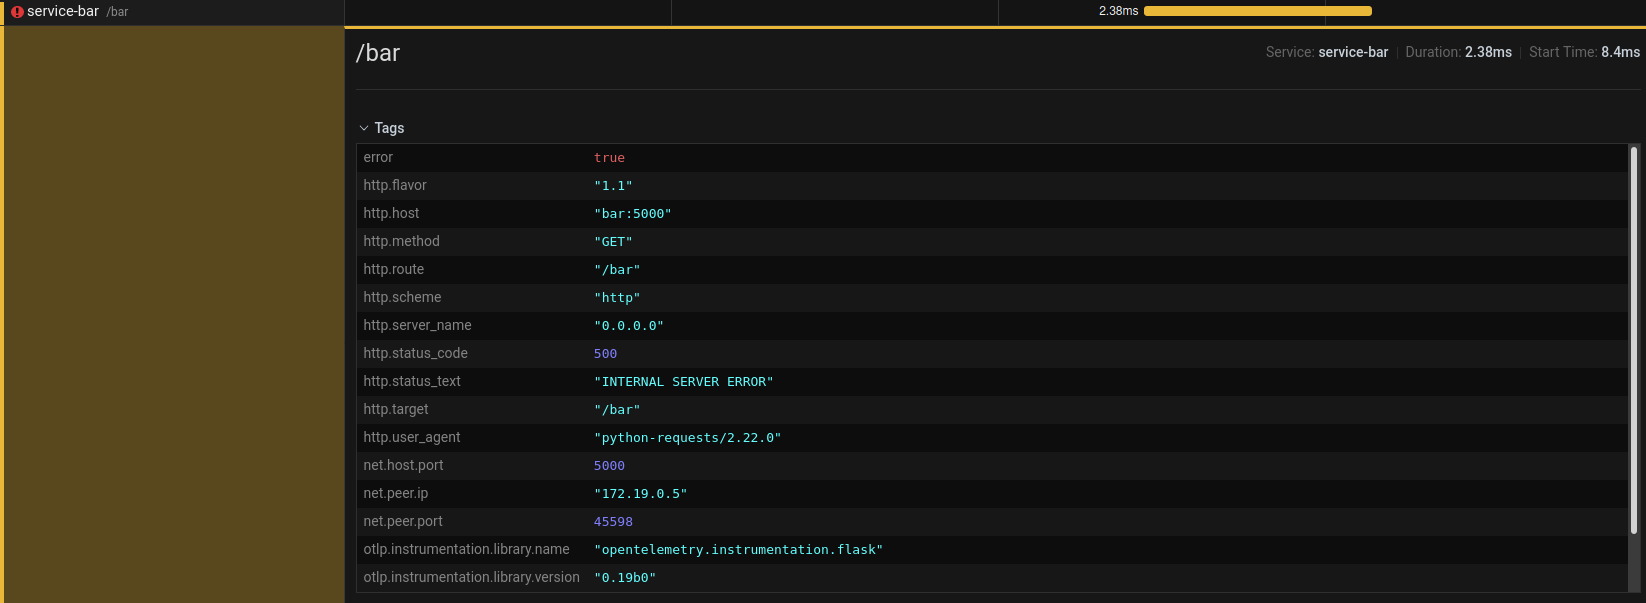
Once we have the log lines of these problematic requests, we can pick the trace_id from one of them, and open the trace in Grafana, as we showed earlier.

As you can see, there are some exclamation points. Not good! Digging deeper into the spans, we can see that the request that foo makes to bar returns a 500 status code.

So it’s probably safe to say that the problem has something to do with the bar service, and how it works. And that’s right! This snippet is part of the bar service code:
@app.route("/bar")
def bar():
   random_value = random()  # random number in range [0.0,1.0)
   if random_value < 0.05:
       return "Edge case!", 500
   return "bar"
Looks like this service is coded to fail randomly… what a design decision.
We should probably remove that. :)
Wrapping up
In this blog post, we’ve played a bit with foobar and discovered some strange behaviors with the help of distributed tracing and k6. If you want to learn more about distributed tracing, check out this previous blog post, “A beginner’s guide to distributed tracing.”
If k6 sounds interesting, take a look at our documentation and the Github repository.
And if you think that Tempo looks cool, watch the “Getting started with tracing and Grafana Tempo” webinar on demand. You can get free open-beta access to Tempo on Grafana Cloud. We have free and paid Grafana Cloud plans to suit every use case — sign up for free now.


