Benchmarking Grafana Enterprise Metrics for horizontally scaling Prometheus up to 500 million active series
Since we launched Grafana Enterprise Metrics (GEM), our self-hosted Prometheus service, last year, we’ve seen customers run it at great scale. We have clusters with more than 100 million metrics, and GEM’s new scalable compactor can handle an estimated 650 million active series.
Still, we wanted to run performance tests that would more definitively show GEM’s horizontal scalability and allow us to get more accurate TCO estimates. We also wanted to understand how memberlist, our alternative KV store to Consul, would perform at high metrics volumes.
To run this test, we developed a tool called benchtool, which generates metrics and query traffic to throw at GEM.
Using this tool, we gradually cranked up the load we threw at GEM and used a combination of metrics scraped from Kubernetes and from GEM itself to understand how it was doing. The results were impressive. Here are the main takeaways from the testing:
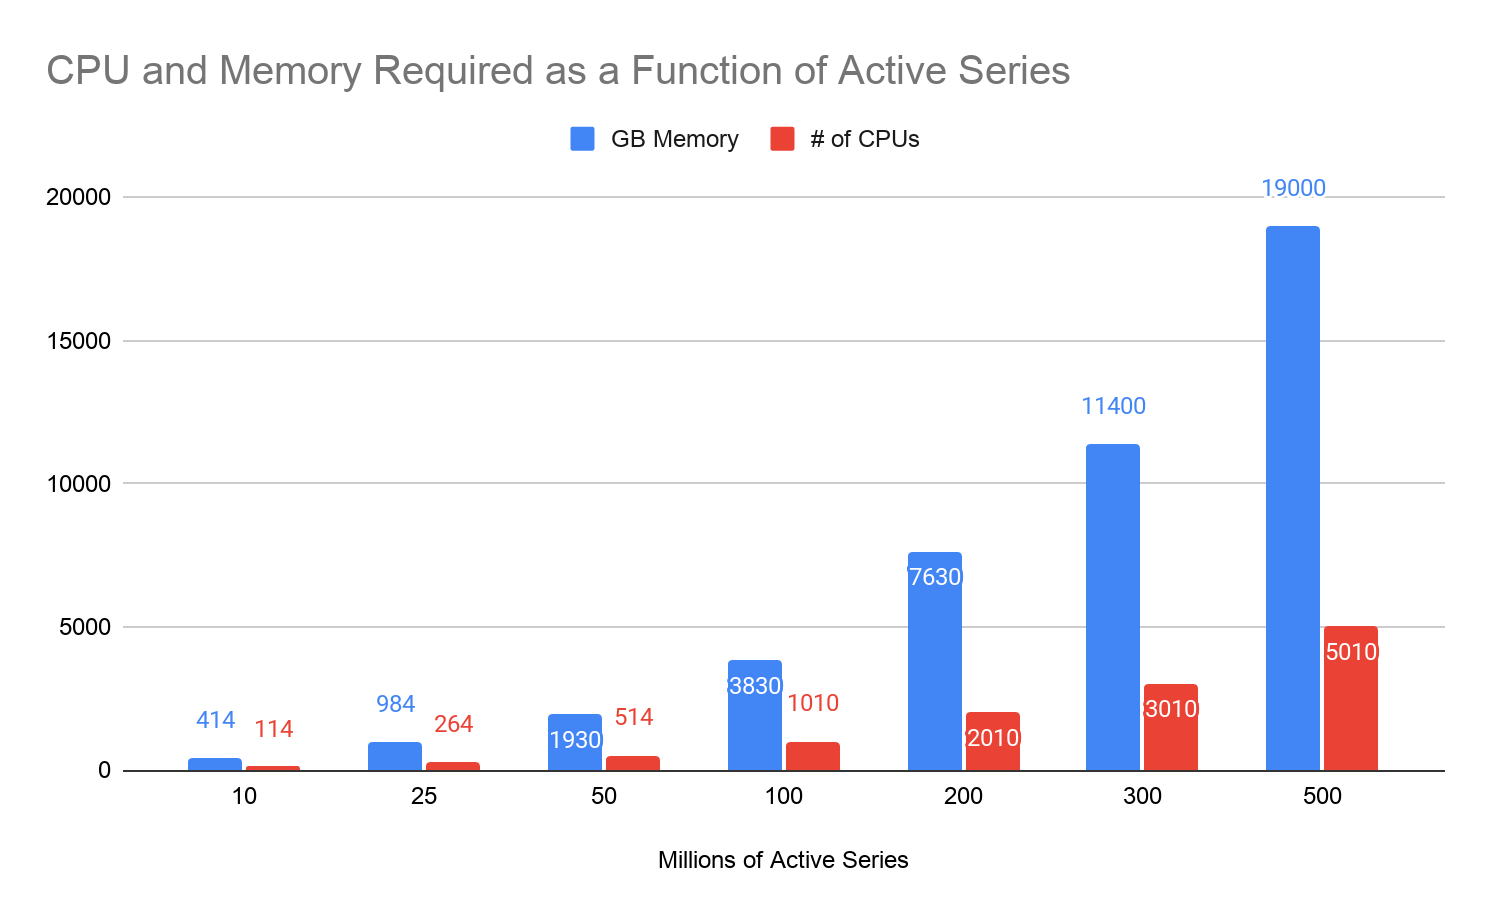
1. GEM hardware usage scales linearly up to 500 million active series.
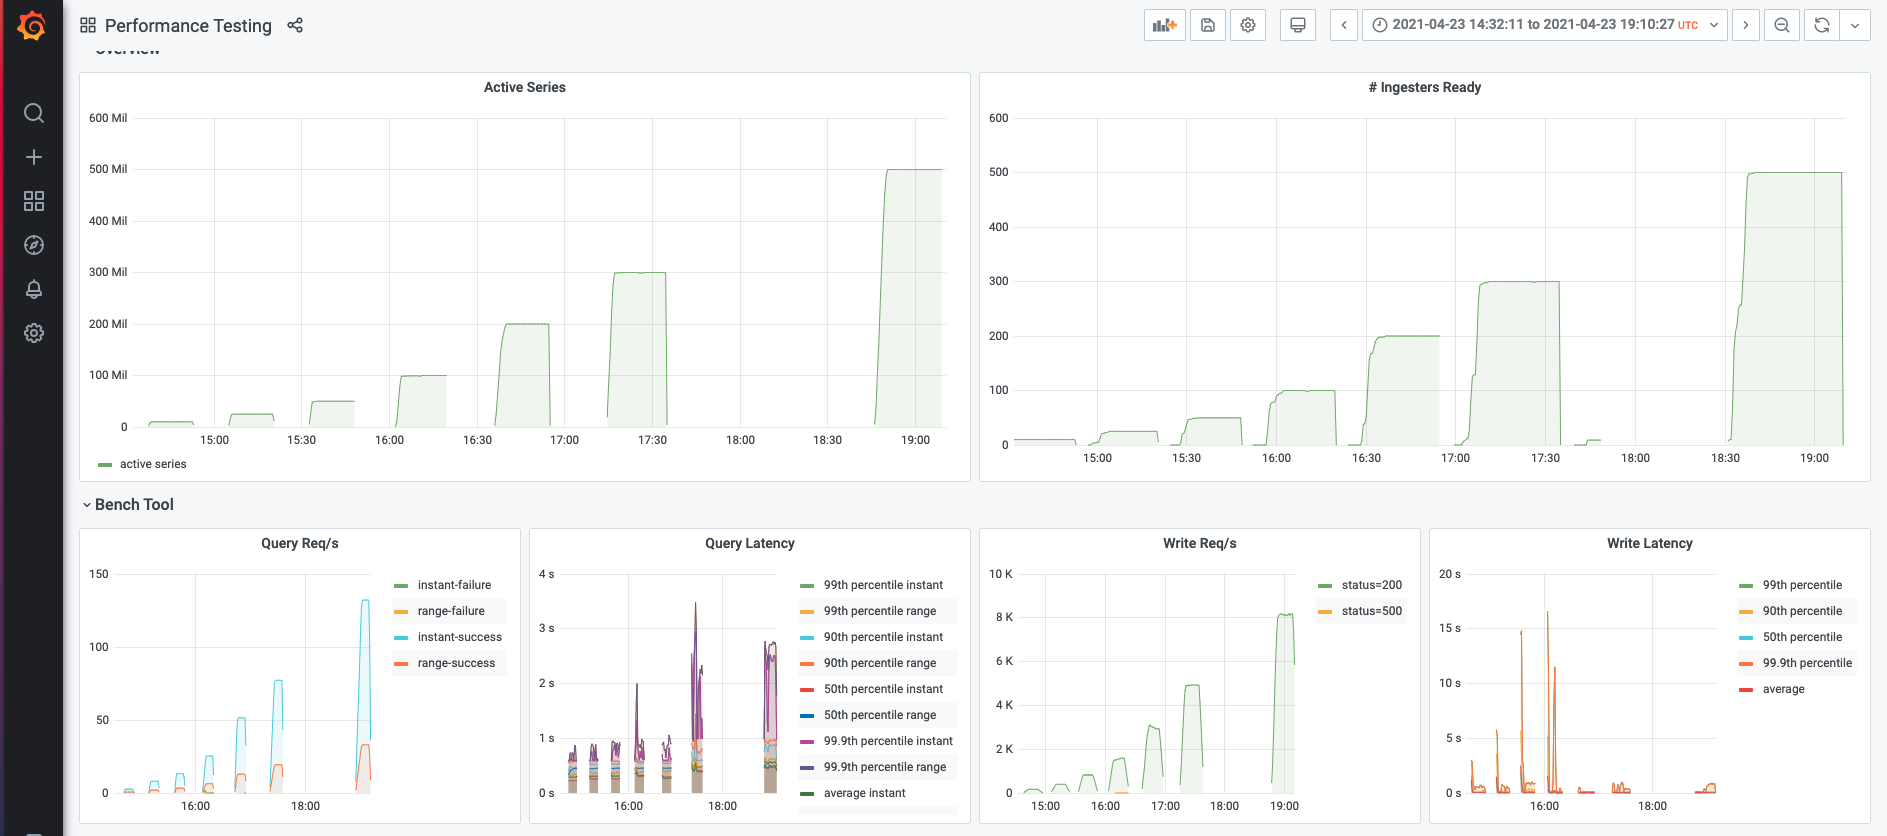
One of the goals for our GEM performance testing was to determine the scalability ceiling of GEM. To determine this, we tested GEM’s horizontal scaling starting with 10 million active series and going up to 500 million active series. (This translates to 85 million data points per second, since we sampled once per minute.)
For each million active series we added, we added another compute node to the GEM cluster. On each node, we ran three separate processes of GEM: a distributor, an ingester, and a querier. Each node was an e2-standard-16 machine on GCP. This allowed us to measure each service independently, while still replicating a single-process deployment in terms of resource sharing.
If at any point in this scaling up we saw more than 1% of write or query requests fail for more than 1 minute, our test would exit, and we would know we’d reached the point at which GEM no longer linearly scaled.
As we’d hoped, GEM passed the test: Linearly increasing node count was enough to handle the linearly increasing metric count. At the highest metric load we tested (500 million metrics), our cluster of 500 nodes was still going strong, successfully servicing all write and query requests.


2. P99 latency for the write path was less than 3.1 seconds.
We can tell that the write path is able to handle the active series by looking at the status codes returned by the ingesters to the distributors. Each data point sent from the distributor to the ingester returns a status code that indicates whether the ingester was able to successfully process that data point.
Our test was constantly looking at the rate of error status codes and would register a fail if the error codes exceeded 1%. Besides looking at the rate of failures, however, we also wanted to look at the time it took for the “success” code to be sent. If that time gets too high, we’re likely heading towards a spike in errors because the data is coming in faster than we can process it. The service time of a request should be lower than the arrival rate of a successive request.
You’ll see from the graph below that up to 500 million active series, the median (p50)latency for the status code being sent is under 0.2 seconds. The 99th percentile (p99) latency is less than 3.1 seconds. Not only does this tell us that we’re able to keep up with the incoming data stream, but this latency is also roughly the delay between when a data point arrives at GEM and when it’s queryable. On average, it took less than 0.2 seconds from a data point arriving to its being queryable.

Unlike the p50 latency, which is relatively flat, you’ll notice that the p99 latency increases up to 100 million active series and then drops. On closer inspection, we concluded this pattern was a testing artifact. For the larger scale tests, we gradually ramped up to the target active series count. The medium scale tests (50-100 million metrics) had a more steep ramp, and as a result, saw write latency spikes at the beginning of the test before stabilizing.
3. Memberlist can handle 500+ ring members.
As my colleague Peter Štibraný has blogged about, we’re using gossip to improve availability in Cortex, which powers GEM. We wanted to prove that gossip — used as an alternative to Consul — could support large workloads, up to 500 million active series.
During all of our testing, we used memberlist as our KV store. This allowed us to show that memberlist is capable of handling 500+ ring members. This is great news, because it means you can run GEM in different environments where you may not have access to Consul.
4. Median latency for the query path was less than 1.35 seconds.
We wanted to also test GEM’s performance on the query path, so as we increased the number of active series, we also increased the query load we threw at it. The tricky part was figuring out a realistic QPS for a given active metrics count. QPS is driven not just by the number of users querying your system, but also by the number of alerting and recording rules you have — both of which tend to scale with the number of metrics you have.
We have a lot of users in Grafana Cloud that we can use to model our workloads, so we chose what QPS to test based on what we saw there. We ended up using a value of 1 QPS for 3 million series in a single tenant. Grafana Cloud usage also helped determine the ratio of instant to range queries, 80:20.
What we saw during our testing was great: For each level of active series, GEM was able to handle the query volume we threw at it: more than 99% of queries successfully returned results.
As with writes, we then looked at latency to understand how long those successful queries took to complete: How long are users waiting for an answer? Median query latency was less than 0.6 seconds for both instant and range queries. P99 query latency was always less than 2.6 seconds for range queries, and less than 2.2 seconds for instant queries.

Conclusion
You can take a deeper dive into the raw results in this Grafana dashboard snapshot.

While this effort focused on stress-testing GEM, we’ve open sourced benchtool for anyone who wants to run tests on Cortex.
Looking ahead, we’d like to test the throughput of the GEM compactor. This component, adapted from the open source project Thanos, compresses the blocks written to object storage by the ingesters, deduplicates replicated data, and merges smaller blocks that are adjacent in time into a single larger block to make querying more efficient.
We’d also like to focus some attention on store-gateway throughput. This experiment focused on queries that were hitting data that was less than 12h old, as we find that’s the most common case for our users. In that scenario, the queries go directly to the ingesters to ask for the data.
When users start issuing queries over longer time horizons (>12h), GEM no longer goes to the ingesters, but rather uses the store-gateway component to fetch the data from object-storage. We’d like to understand how many concurrent queries store-gateways can cover and characterize their response latency as a function of query volume.
We’ll report back when we complete our next round of performance tests on GEM!
If you want to learn more about Grafana Enterprise Metrics, you can watch the “Running Prometheus-as-a-service with Grafana Enterprise Metrics” webinar on demand. You can also read more about GEM in the docs, and contact us if you’d like to try it out!


