How PayIt, a secure cloud service provider for digital government, uses Grafana and Prometheus for observability at cloud native scale
A trip to the DMV — and a realization that there had to be a better, more modern way for the system to work — sparked the idea for PayIt, a secure cloud service provider for digital government that launched in 2013. The company’s mission is to help state, local, and government agencies reach their constituents better and more effectively, shifting the reliance from in-office payments to digital ones.
Since 2015, PayIt has relied on Grafana for its alerting and observability needs. Grafana has helped the company successfully deliver an award-winning product to its external clients, as well as provide internal teams the data they need to monitor their complex systems and solve issues quickly.
PayIt, which uses a microservices-based architecture, was a very early adopter of Kubernetes, running it for container orchestration since 2015.
At the beginning of the startup stage — before they began using Grafana — PayIt had one Kubernetes cluster, which made it easy for the infrastructure team to monitor everything manually. There was also minimal clutter in the logs, making service logs and files easy to find.
But as PayIt’s business scaled and the company rolled out more services, they had no easy way of knowing if a service downstream might be impacting a different service upstream — or how to query things to find out. Solving user-facing issues was also becoming more challenging.
PayIt was always on the lookout for cloud native solutions, and found theirs with Grafana and Prometheus.
Tapping into the community dashboard ecosystem
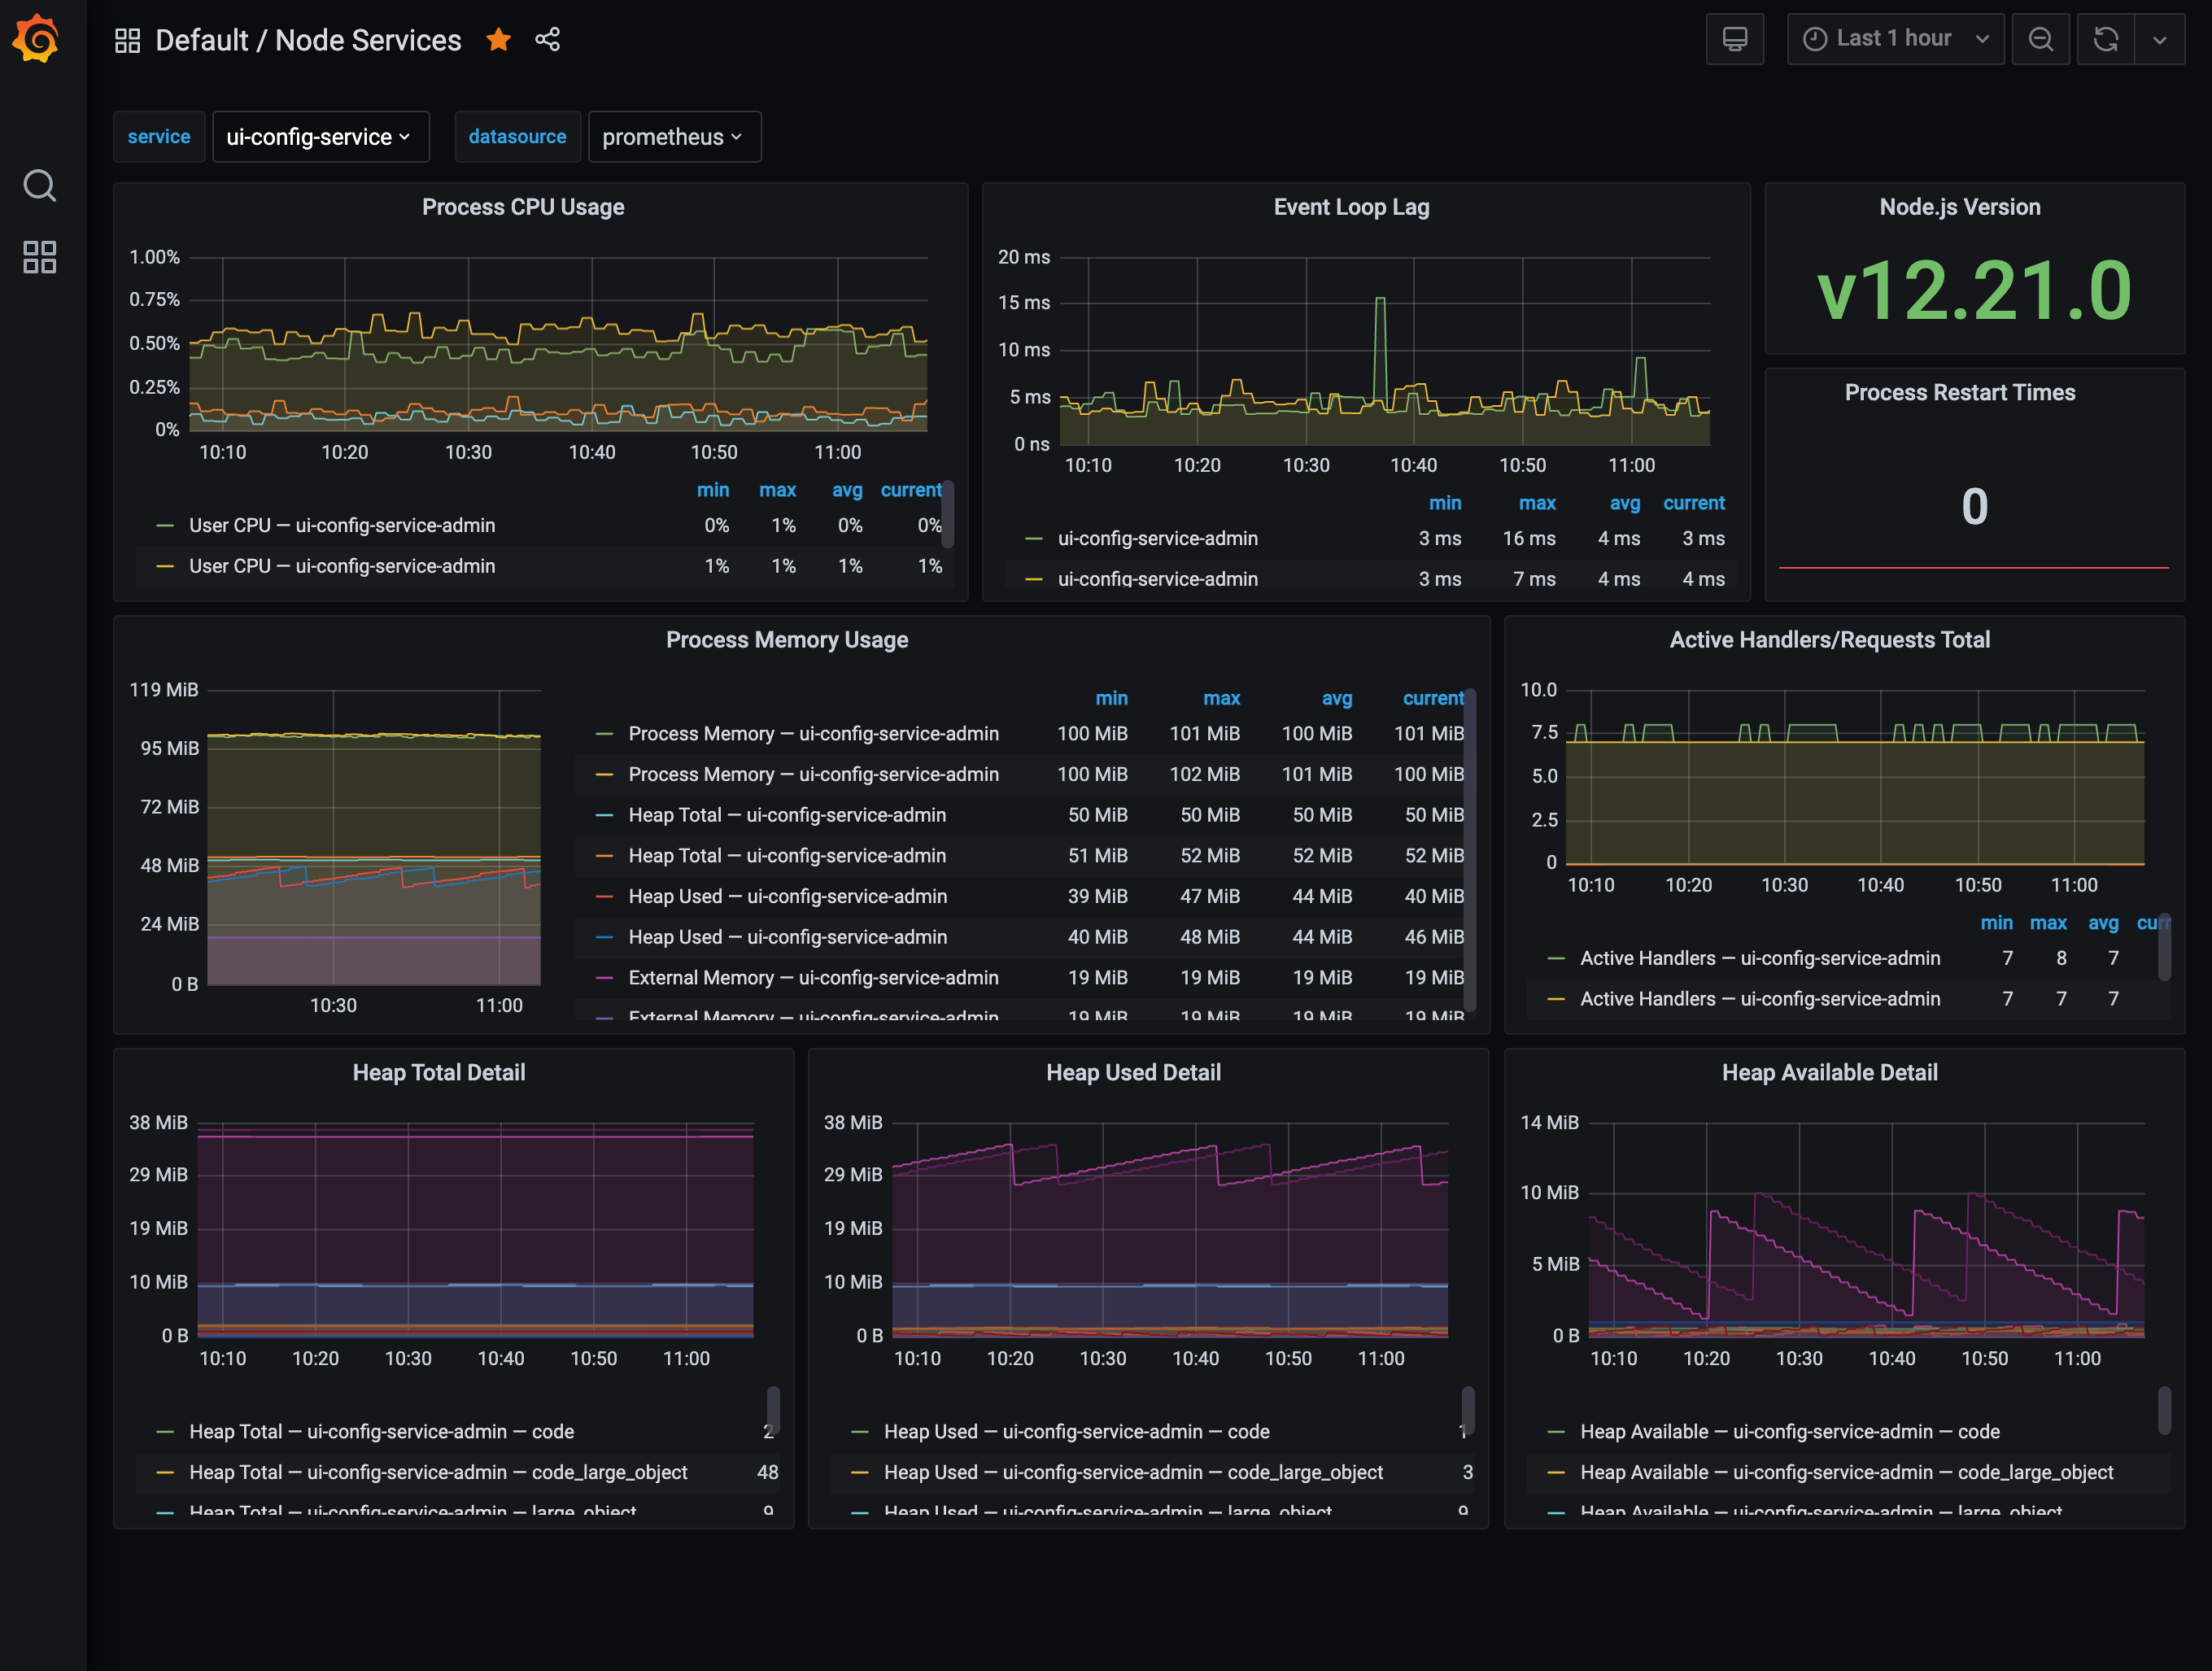
PayIt currently has 36 Grafana dashboards consisting of hundreds of panels. About half of them are Kubernetes-based (cluster monitoring, pod monitoring, workflow, workload, control plane monitoring). Others cover Java services, node services, and metrics.
The team got off to a quick start using Grafana by leveraging the existing community dashboards. “With the Grafana dashboards, we don’t have to infer anything, it’s all laid out explicitly,” Matt Menzenski, a software engineering manager for PayIt’s maintenance team, says. Because creating a Grafana dashboard doesn’t require special expertise, PayIt also has been able to build out some custom dashboards tailored to the specific needs of the business.

PayIt’s Production Node Service Dashboard
Menzenski says that realizing they could visualize their existing data and make it more intelligible to non-engineers was a real “aha” moment.
With Grafana, PayIt has been able to catch and prevent customer-facing issues, and they’ve been able to change the way many of them are handled internally. Anyone with a PayIt email is authenticated to view the dashboards, and as a result, non-engineers, including the support team, have access to data. So during a support issue, there’s no longer a need to wait on the maintenance team — a potential customer experience bottleneck.
Now that they know what Grafana can do for them, PayIt is considering broader ways to use it.
“There’s a lot of potential that we’re really just starting to think about,” Menzenski says. “I personally feel like I’ve only really just scratched the surface of what I can do with this tool.”
To learn more about how PayIt uses Grafana, check out their full success story here.
The easiest way to get started with Grafana, Prometheus, Loki for logging, and Tempo for tracing is Grafana Cloud, and we’ve recently added a new free plan and upgraded our paid plans. If you’re not already using Grafana Cloud, sign up today for free and see which plan meets your use case.


