How to send traces to Grafana Cloud's Tempo service with OpenTelemetry Collector
As an open source company, we understand the value of open standards and interoperability. This holds true for Grafana Cloud and our managed Tempo service for traces, which is currently in beta.
The Grafana Agent makes it easy to send traces to Grafana Cloud, but it is not required. In fact, Grafana Cloud’s Tempo service is exposed as a standards-compliant gRPC endpoint that conforms to the Open Telemetry TraceService with HTTP Basic authorization. Any tooling that can call the endpoint with the proper HTTP header can send traces.
This post will show how to do just that using the OpenTelemetry Collector.
Getting started
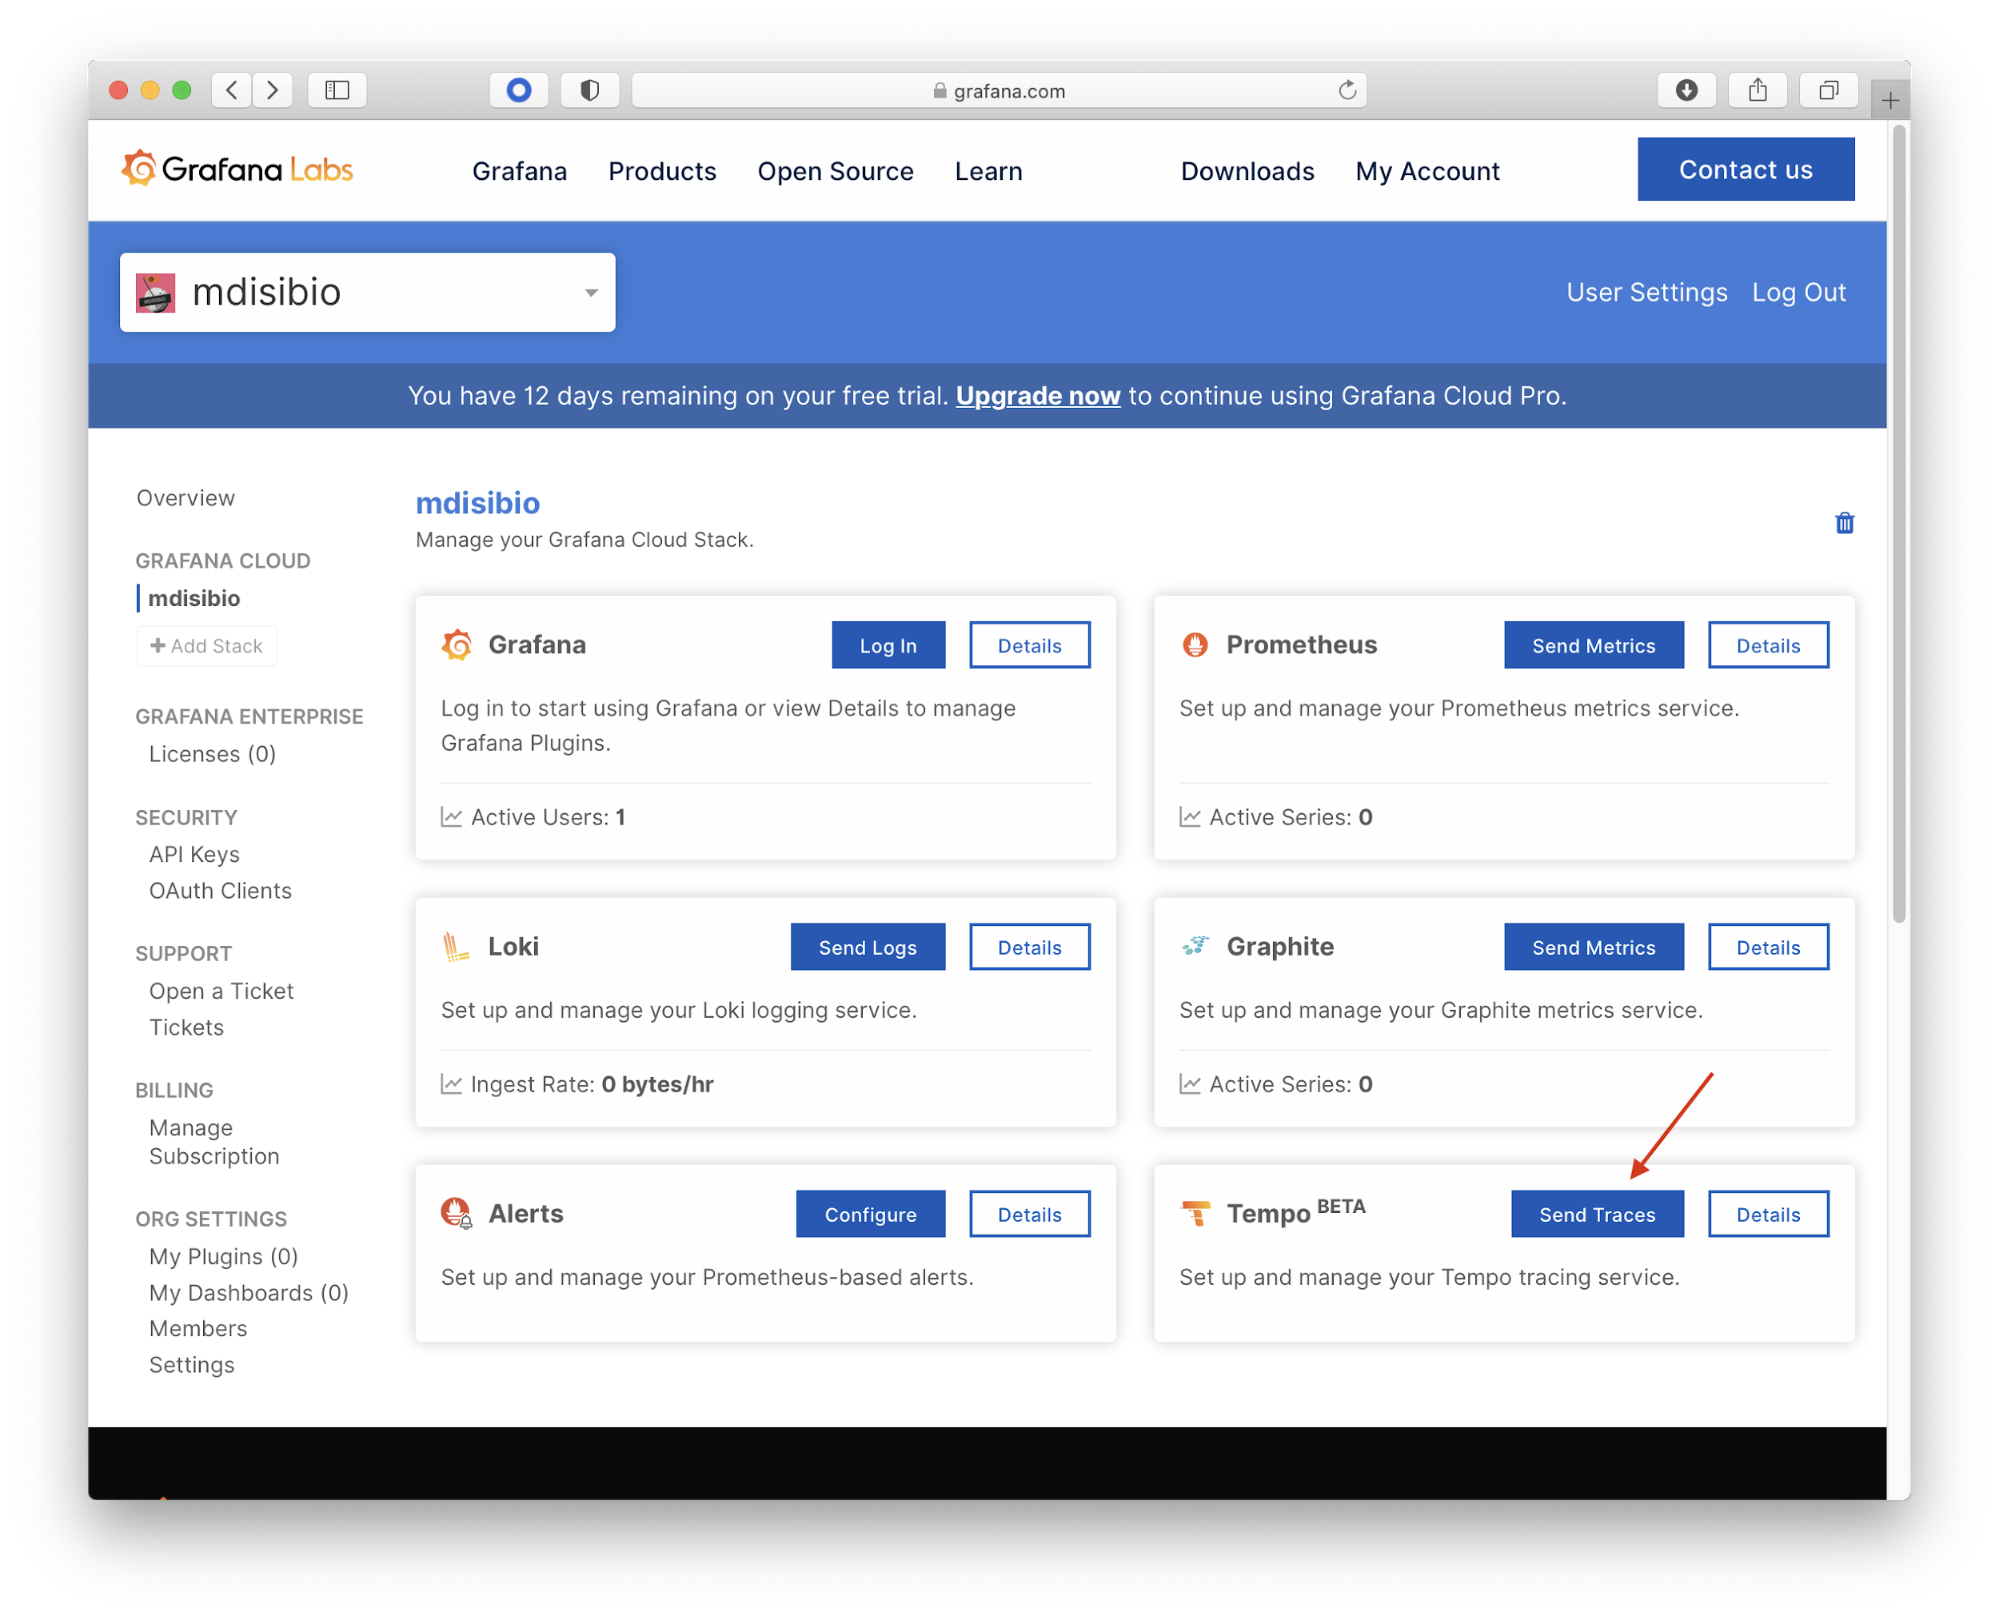
The first step to getting started is to gather your Grafana Cloud URL and credentials for Tempo under the My Account page. Choose the stack, then Send Traces to view your username and URL. API Keys are managed under the Security -> API Keys section.

Configuring the Collector
The next step is to create the configuration file for the Open Telemetry Collector. Create a file named otel-config.yaml with the following content:
receivers:
 jaeger:
   protocols:
     thrift_compact:

processors:
 batch:

exporters:
 otlp:
   endpoint: tempo-us-central1.grafana.net:443
   headers:
     authorization: Basic <base64 data>

service:
 pipelines:
   traces:
     receivers: [jaeger]
     processors: [batch]
     exporters: [otlp]
This configuration has four parts:
- The
receiverssection controls the protocols and formats of traces that can be received. This example only enables support for Jaeger Thrift over compact Thrift protocol, but any OpenTelemetry trace receiver is supported. - The
processorssection adds the batch processor, which batches up data before uploading to help with performance and compression. This is a best practice. - The
exporterssection adds theotlp(OpenTelemetry Protocol) exporter, which is the gRPC-based protocol to be used with Grafana Cloud. Theendpointis the url for your Grafana Cloud stack. Theheaderssection adds the HTTPAuthorizationheader in Basic format. We will come back to the base64-encoded credentials in a bit. - The
servicesection brings the previous three sections together by building the final pipeline for trace data.
The Authorization header is configured with Basic scheme, which is a base64-encoded version of the text <user>:<password>. There are a multitude of ways to create this value, including commands and web pages, but here is a simple example command:
$ echo -n "<your user id>:<your api key>" | base64Copy and paste the output value to the configuration file.
Running the Collector
To make things easy, this example will run the collector and send data to it from the Jaeger HotROD demo using docker-compose. Create a docker-compose.yaml with the following content:
version: "2"
services:

 hotrod:
   image: jaegertracing/example-hotrod:latest
   ports:
     - "8080:8080"
   command: ["all"]
   environment:
     - JAEGER_AGENT_HOST=collector
     - JAEGER_AGENT_PORT=6831

 collector:
   image: otel/opentelemetry-collector:0.23.0
   command: "--config /etc/otel-config.yaml"
   volumes:
     - ./otel-config.yaml:/etc/otel-config.yaml
The HotROD demo is pointed at the collector via environment variables. The configuration file for the collector is mounted and specified in the command line arguments.
Start everything with docker-compose up and browse to http://localhost:8080 to interact with the HotROD demo. Click the buttons to start generating tracing data.
Viewing a trace
To confirm everything is working, gather a trace ID and view it in Grafana Cloud. The HotROD demo logs all trace IDs to stdout, which can be viewed with the following command:
$ docker-compose logs --tail=1 hotrod
Attaching to compose-cloud-collector_hotrod_1
hotrod_1     | … Dispatch successful	 ... "trace_id": "32f2c9dcb3456820"...
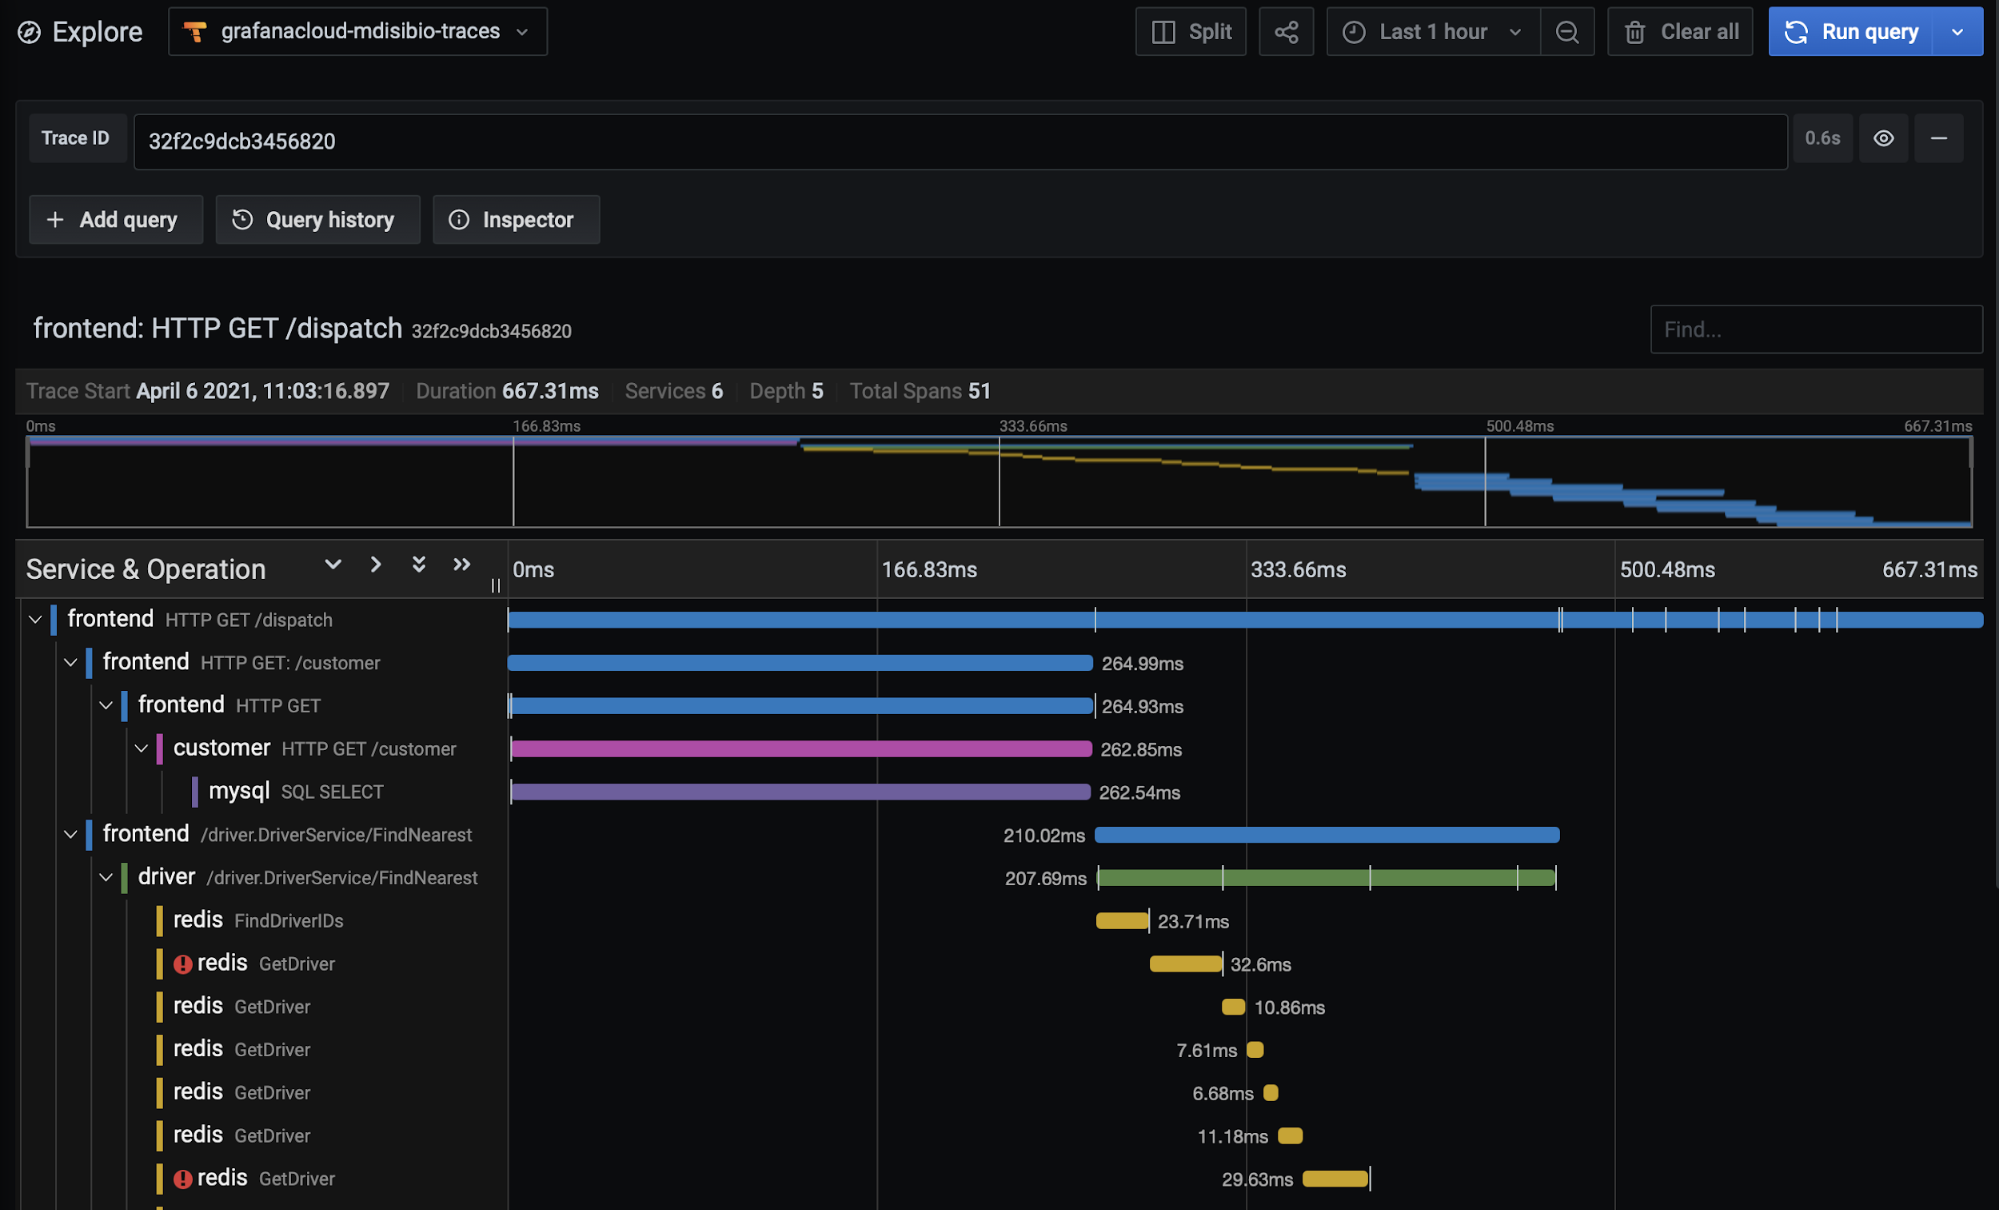
Next, search for the trace in Grafana Cloud by navigating to Explore and choosing your traces data source. And there you have it!

Wrapping up
In this post we have seen how Grafana Cloud uses industry standards to provide a high degree of flexibility to allow you to use the tooling that works for you. If you are already using or would like to know more about using the Grafana Agent, check out our previous blog posts for getting started sending traces and instrumenting for Java and .NET.
To try out the beta of our managed Tempo service for traces, sign up for Grafana Cloud for free. Grafana Cloud is the easiest way to get started observing metrics, logs, traces, and dashboards, and we have free and paid plans to suit every use case.


