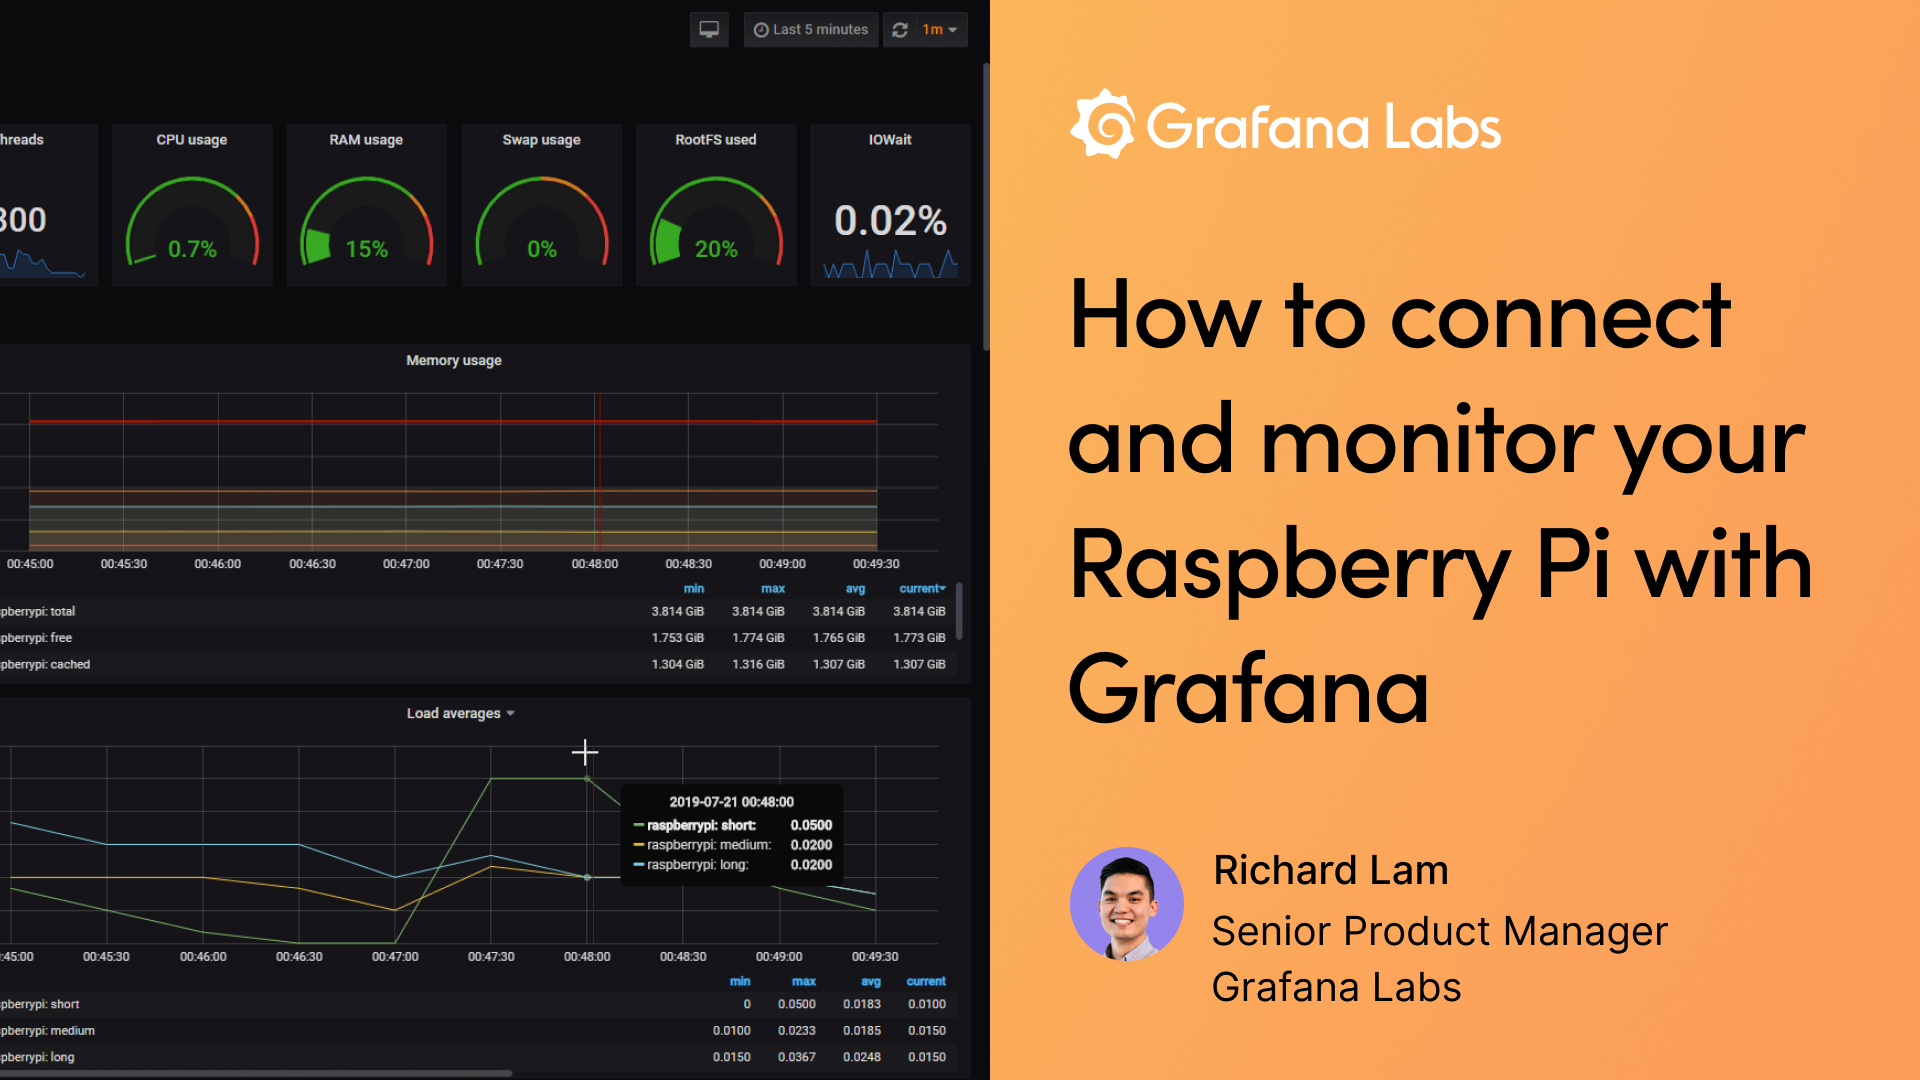
Learn how to monitor your Raspberry Pi with Grafana Cloud during this week’s live webinar
Thanks to its low cost and small size, the Raspberry Pi has become a popular hobbyist tool for running all sorts of software experiments. On our blog, we’ve showcased Raspberry Pi projects that use Grafana for monitoring homelab security and 3D printing.
To get started with your own monitoring projects, you can follow this tutorial on how to install Grafana on your Raspberry Pi. If you want to use Grafana without having to go through a full installation process, check out Grafana Cloud, which is designed to be the easiest way to get started creating dashboards and observing metrics, logs, and traces. When you sign up for a Grafana Cloud account, you get 10K series for Prometheus or Graphite metrics and 50GB of logs for free, forever. With your free account, you also get access to a growing library of integrations (prebuilt dashboards and alerts) and can easily connect and monitor your Raspberry Pi using the Grafana Agent. A great one to start with is the Linux integration.
If you’re interested in learning more, don’t miss the free webinar I’ll be presenting on April 8 at 16:30 UTC, “How to connect and monitor your Raspberry Pi with Grafana.” I’ll walk you through how to get a working dashboard in minutes, all the different ways you can connect your data with Grafana Cloud, and how to get preconfigured metrics, dashboards, and alerts with integrations. I hope you’ll join us!


