
Want to visualize software development insights with Grafana? With our new Jira Enterprise plugin, you can!
This post has been updated to reflect changes in the availability of the Jira data source plugin for Grafana Cloud users.
A very fun part of my job as a Solutions Engineer at Grafana Labs is getting to learn the ins and outs of a new feature or play with a plugin while it is still in development. So, when I heard murmurs that our latest Enterprise plugin would be an integration with Jira, I felt the forsaken call of the agile sirens luring me back to my days when I worked as a technical writer on a product team.
What started as a singular responsibility to document “All the things!” in Atlassian’s wiki product, Confluence, quickly evolved into also donning the cape of a Jira admin. I delved headfirst into the scrupulous world of agile software development where magic, plans, and life happened between the bookends of a sprint.
Jira — a software development tool synonymous with team collaboration and planning — may not appear to be like the cast of data sources that have typically been popular to visualize with Grafana. But that’s the nexus of what makes Grafana so good: You can tell a meaningful visual story from any type of data. Really. And after a quick evening cavorting with our Jira plugin and reacquainting myself with issue types, workflows, and Kanban boards, I’ve come to this emphatic conclusion: If you are not visualizing your Jira issues with Grafana, then what are you even doing with your life?
Dramatics aside, we are super excited (can you tell?) to introduce our new Jira data source plugin! Give users across your organization — such as product managers and developers — comprehensive insights into their development process to better understand mean time to resolution, issue throughput, and sprint velocity. By performing powerful analytics using Jira data and Grafana transformations, and visualizing it alongside metrics from any other data source, software teams are equipped and enabled to further fine-tune their planning process to ship faster and more reliably.

This example sprint status dashboard visualizes metrics such as story points and open tickets from Jira alongside code repository data such as pull requests from our GitHub plugin.
Configuring the Jira plugin
To start visualizing Jira issues within Grafana, all you need to do is install the plugin and provide your Atlassian instance URL, en email for a user account, and an API token for that user account.
Once the data source has been tested and saved, create a new panel in a dashboard and select Jira as the data source. You are ready to begin querying your Jira issues!
Search for issues
The Jira Query Editor queries Jira for issues, which can be anything from bugs to user stories. At a bare minimum, select the issue fields (such as Sprint Name or Created Date/Time) for which you’d like to display from the Select Fields dropdown. Switch to a table view, and you will see the selected fields for your issues.

Using the Filter (JQL) input field, you can type in a JQL filter to further narrow the scope of your search, such as choosing a project name and issue type. Click on the play icon to the right of the filter field to apply the filter.

Transformations for Jira queries
A table view is a great starting point to visualize your Jira issues within Grafana, but you can further augment and enhance your JQL query with transformations to perform complex calculations on your issues data to understand things such as completed story points versus what was estimated.
As you are querying your Jira data source, use transformations to massage your issues data to extract deeper insights and extend your visualization options. From our growing list of transformations, here are the top three to use with JQL so you can take advantage of SQL-like capabilities.
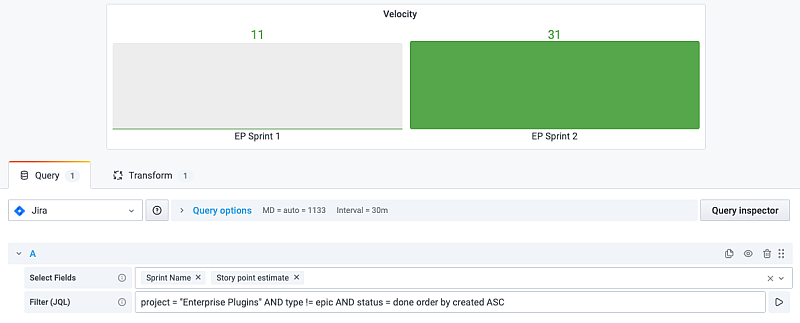
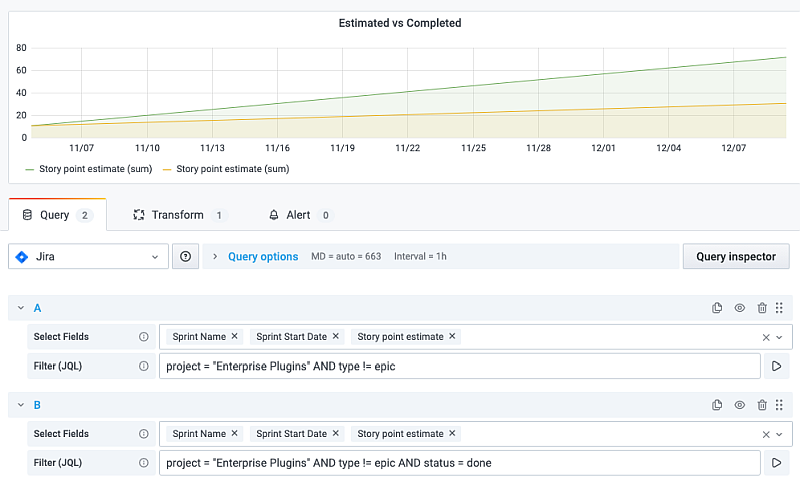
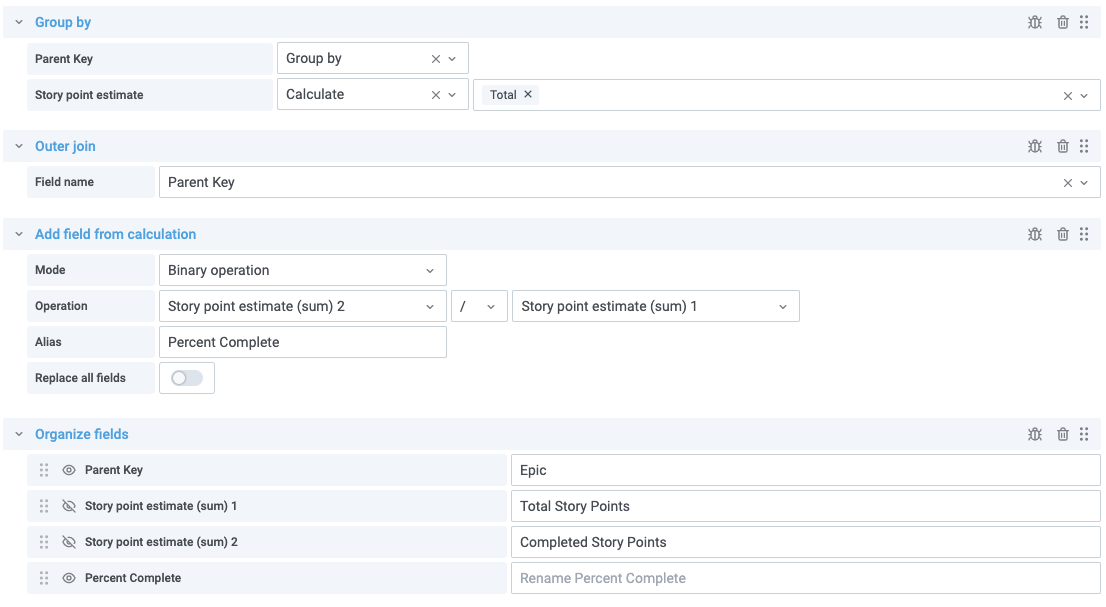
Group by: You can group your issues by Sprint Name or other fields to get aggregation metrics such as velocity and story point estimates versus actual story points completed in a sprint.
Outer join: Join two or more queries together by common fields so you can combine datasets from multiple queries and use other transformations to calculate new values.
Add field from calculation: This transformation creates new fields for your dataset based on calculations of other fields. You can add a field based on a single query or from queries you’ve joined together.
With transformations, you can leverage your Jira data to show things like:
- Velocity, or the amount of work a team can tackle during a sprint (using Group by)

- Story points completed versus estimated (using Group by)
- Progress against epics (using Group by, Outer Join, Add field from calculation, and Organize fields)
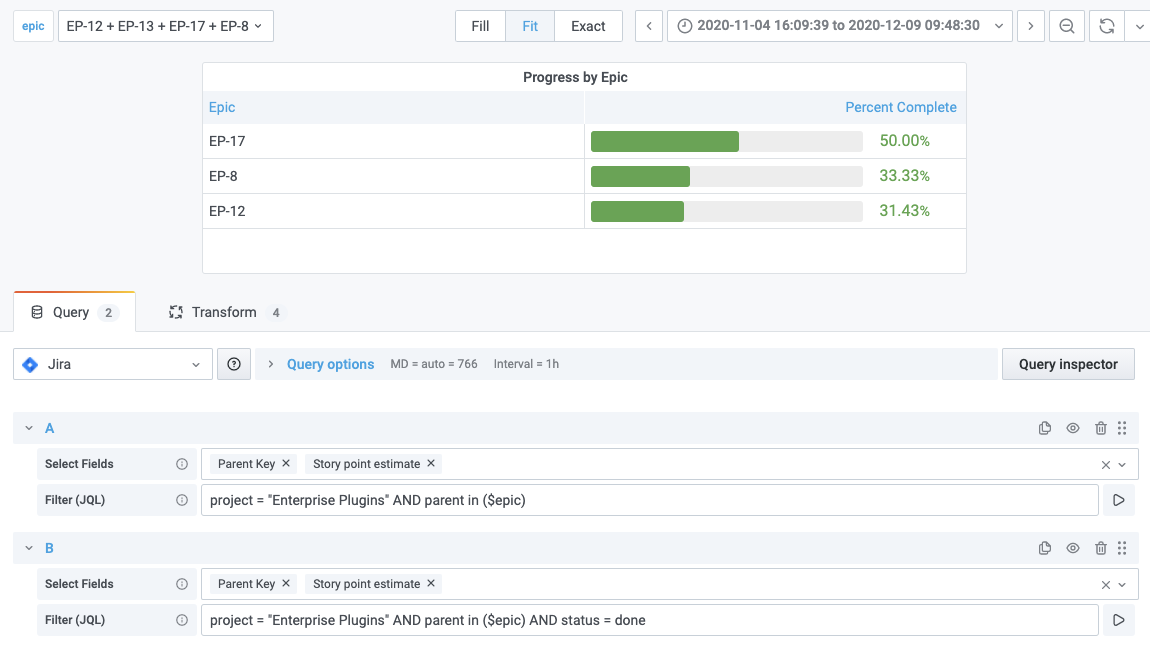
This view uses a template variable to get epics. Make sure to select multi-value so all epics can be selected in view.

Template variables, annotations, and more
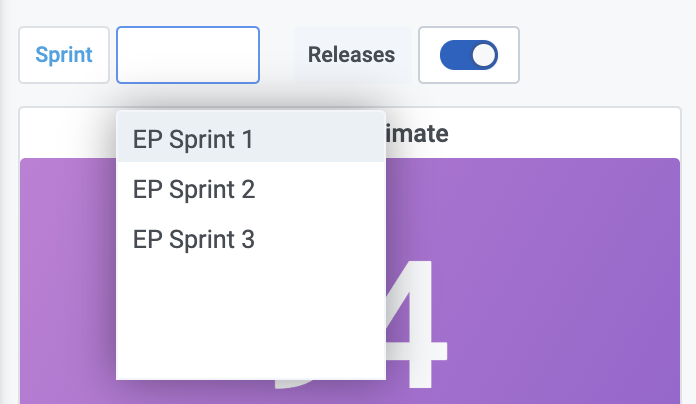
Enable dynamic filtering of your dashboards by defining variables and referencing them in your JQL expressions. For example, create a sprint status dashboard and choose between sprint names to compare past and present velocity, or create a task status dashboard and filter based on assignees.
Overlay annotations on any graph to correlate events in Jira (such as release dates or issue creation) against time series metrics from other data sources, such as application performance metrics.

And don’t forget about alerts! You can absolutely set up alerts for your Jira graphs when, for instance, you want to receive a notification if your sprint estimates are outside the average velocity. With Grafana features such as transformations, template variables, annotations, and alerts, the possibilities of what you can implement and create with your Jira data are truly endless — we look forward to learning about your use cases!
Learn more
To find out more about the Jira plugin, which is available for users with a Grafana Cloud account or with a Grafana Enterprise license, check out the Jira solutions page or contact our team.
If you are already using Jira, give us a shout. We truly value your feedback and ideas on how we can improve the plugin
Last but not least, thank you to Scott Lepper and Andrew Hackmann, for your collaboration on this blog post!
If you’re not already using Grafana Cloud — the easiest way to get started with observability — sign up now for a free 14-day trial of Grafana Cloud Pro, with unlimited metrics, logs, traces, and users, long-term retention, and access to one Enterprise plugin.


