
How I built a monitoring system for my avocado plant with Arduino and Grafana Cloud
A couple months ago, during our Grafana hack days, I created my first monitoring solution: my sourdough monitoring system. It was a lot of fun to build it, and I enjoyed it a lot! So when the next Grafana hack day was approaching, I started to wonder what my next monitoring system could be. What would I like to learn more about? What would I like to get better at doing? To be honest, I didn’t have to think hard. I just looked around, and there they were: my beautiful plants that I love, but for sure don’t know how to take care of. So I decided to do my best to understand them and build a monitoring system for my plants. Specifically, a monitoring system for my avocado plants.

What to monitor?
Whenever I start with any monitoring project, I begin with writing down a list of variables that could tell me more about the system that I would like to monitor. In this case, it is the external outputs of the plant and also the environment in which it is growing. My goal is to list as many variables as I can think of, and then figure out what could actually be monitored and what I would be able to build. In this project I am going to be monitoring:
- Height of the plant
- Air temperature
- Air humidity
- Soil moisture
- Light conditions
The hardware
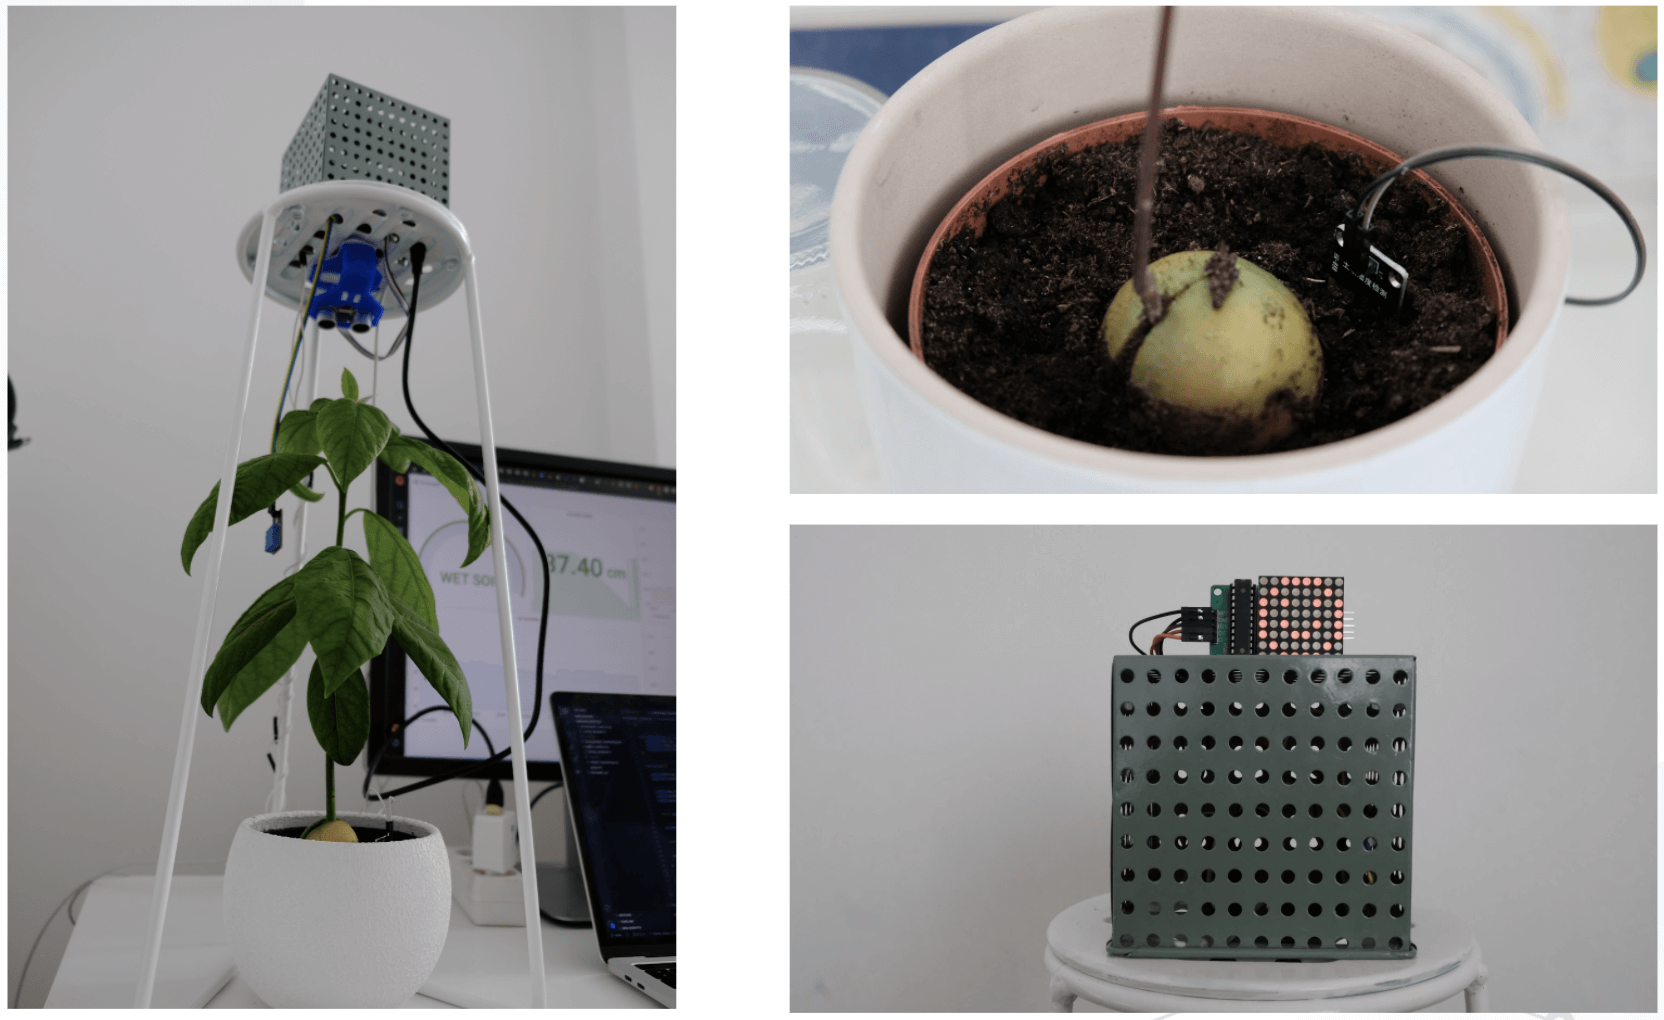
To build my avocado plant monitoring system, I used:
- 1 ESP32 WiFi Bluetooth 4MB Flash UNO R3 development board
- 1 HC-SR04 ultrasonic distance sensor to measure the height of the plant
- 1 DHT22 sensor module to measure the temperature and humidity of the environment
- 1 Soil Moisture sensor module to measure the soil moisture
- 1 TEMT6000 light sensor to measure the light intensity
- 1 LED display MATRIX MAX7219 to show current conditions of the plant directly on the monitoring system
- 1 25 points breadboard
- M-F Dupont Cables
- 1 micro USB cable
- 1 USB charger
You’ll also need:
- 1 plant stand to put this all together and build the monitoring system
The software
You’ll need to install the Arduino IDE open source electronics platform for easy-to-use hardware and software. Arduino compiles the code and then uploads it to your board. I’ve installed version 1.8.10, since newer versions were throwing errors on OS Big Sur, which I use. It worked well.
If your OS won’t recognize the USB serial automatically, you’ll probably need to install CP210x USB to UART Bridge VCP Driver.
Setting up Grafana Cloud
The next step is to set up our databases and Grafana. I have decided to use Grafana Cloud — which comes with hosted Grafana, Grafana Loki, and Graphite — for our data storage and data visualization. The free tier comes with 10,000 series for Graphite metrics and 50GB for logs in Loki, which is definitely more than enough for this monitoring solution.
I went to the Grafana Cloud signup and created a new account. As soon as I had my account all set up, I could see my portal with my hosted Grafana, Loki, and Graphite instances.
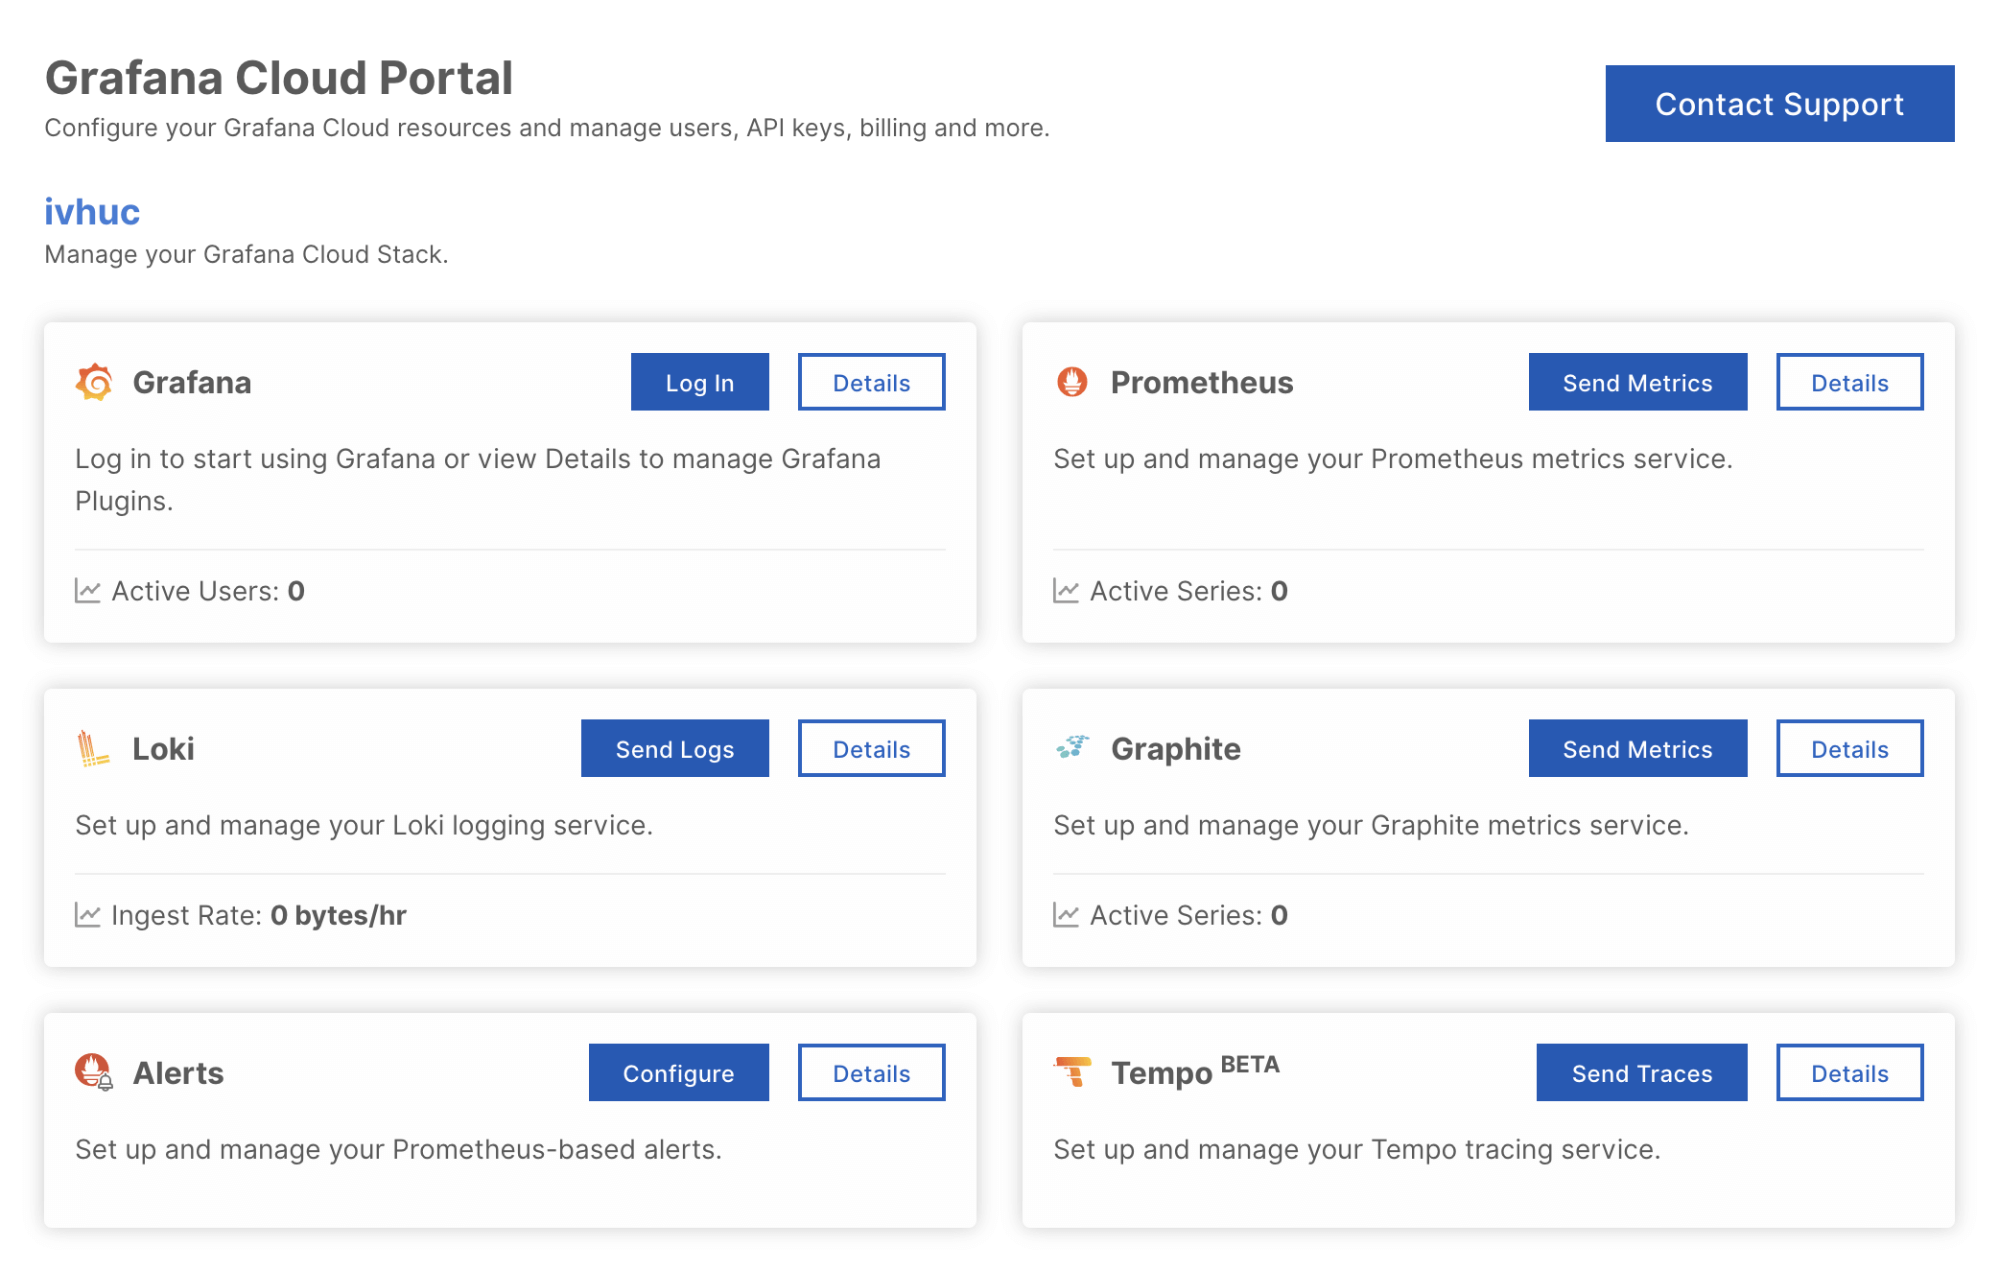
At this point, I’ve also created my API keys for Loki and Graphite to publish metrics from my monitoring system to these databases.

The hook-up
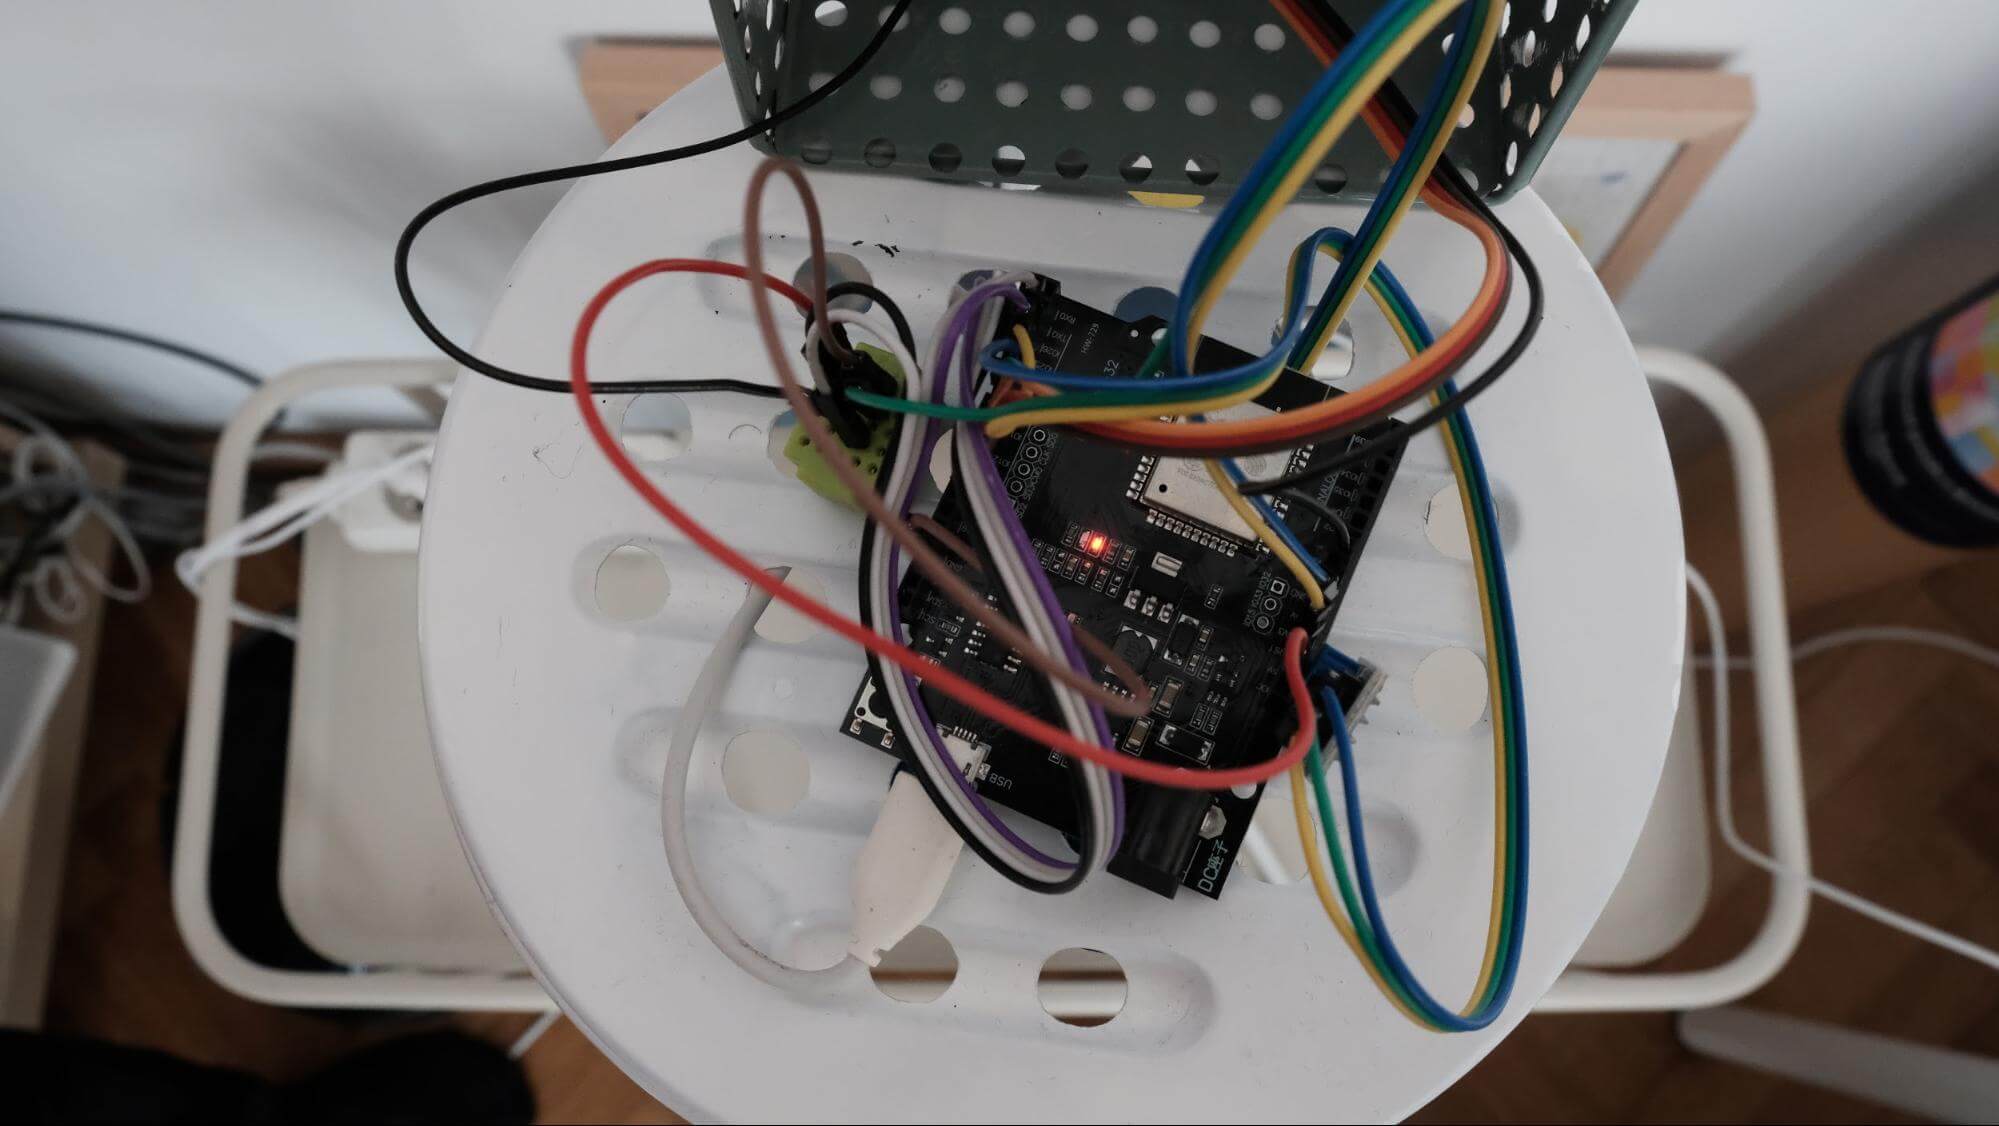
Now it’s time to start putting things together. Below, you can see the pinouts of all sensors and outputs:
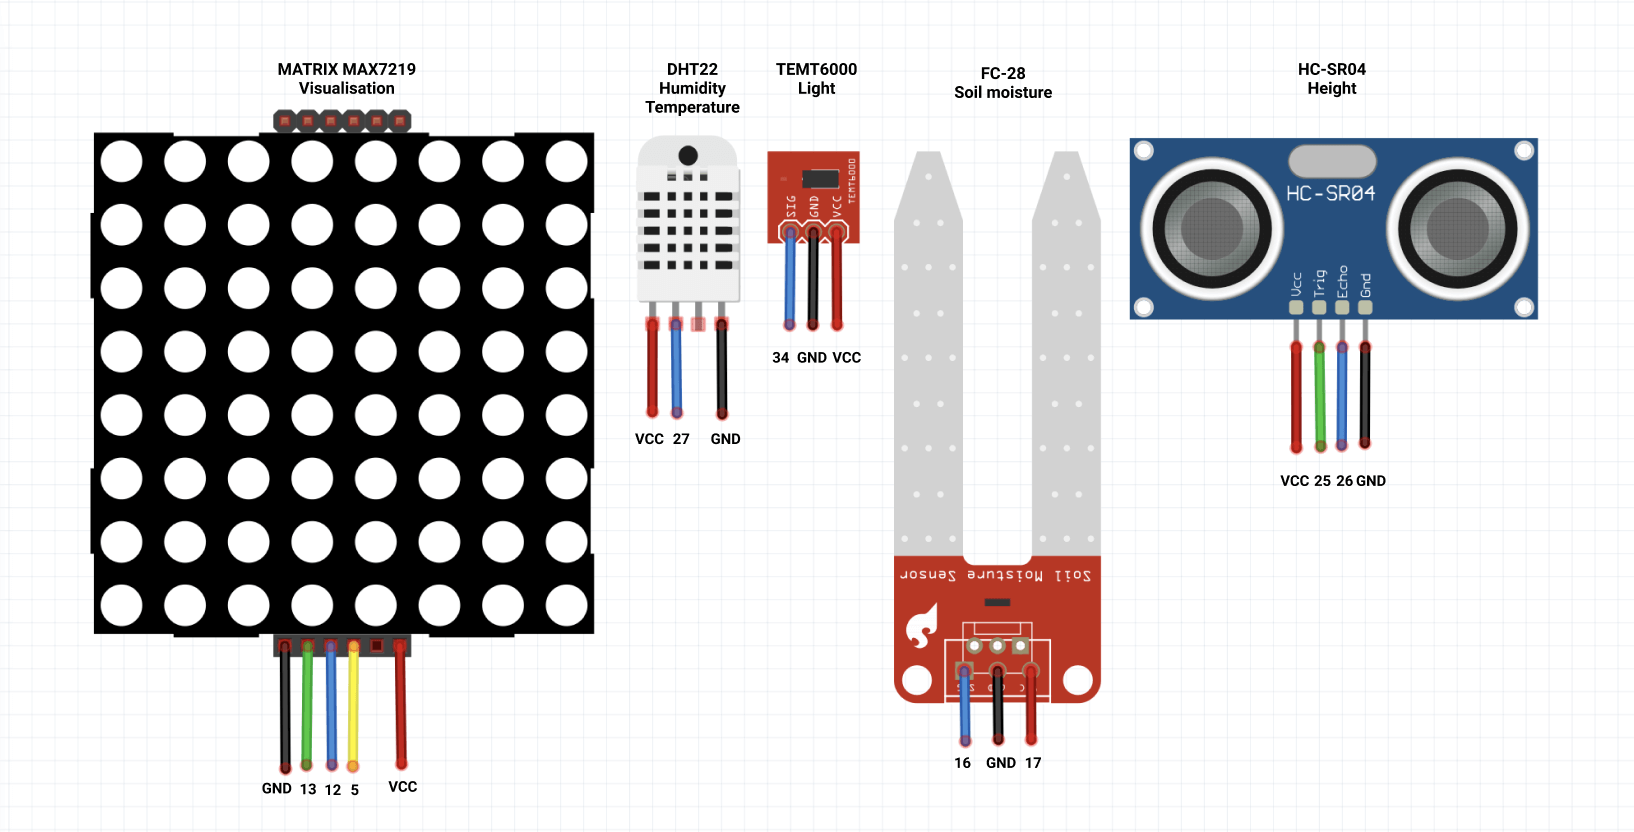
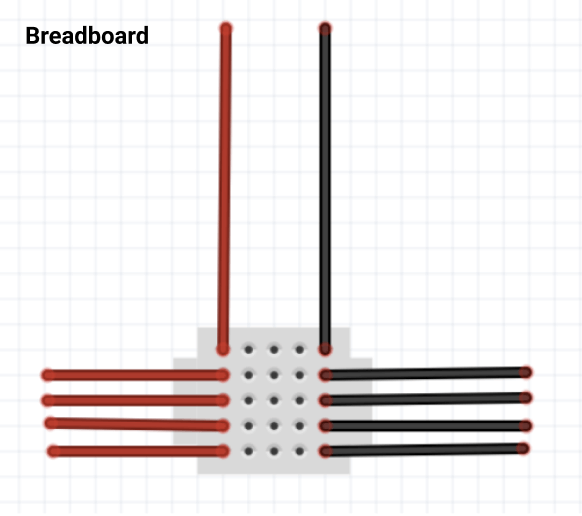
As I had more inputs and outputs than power and ground pins, I also used the 25 points breadboard. I wired it to the vcc pin and gnd pin, so I created 3 extra gnd and vcc pins that I will use for my inputs and outputs.
LED display MATRIX MAX7219
The 8x8 LED matrix is often used to display simple graphics or texts. I decided to use it to display the state of my plant. If the plant has perfect conditions, I see a smiley face on the LED matrix. On the other hand, if the soil is dry or the temperature is too low or too high, a sad emoticon is displayed.
Pinout:
- VCC pin to 5V on the breadboard
- DIN data input pin to pin 5 on board
- CS chip select pin to pin 13 on the board
- CLK serial input pin to pin 12 on the board
- GND pin to GND on the breadboard
The DHT22 sensor module
This is a very basic and cheap sensor made of two parts: a humidity sensor and a thermistor. In this case, it is used to measure the temperature and humidity of the environment in which my avocado plant lives.
Pinout:
- VCC pin to 3.3V on the board
- DATA pin to pin 27 on the board
- GND pin to GND on the breadboard
The TEMT6000 light sensor
This light sensor will detect the brightness of my avocado plant’s surroundings. TEMT6000 measures illuminance that is measured in lux. TEMT6000 is very intuitive to use: More current means brighter and less current means darker.
Pinout:
- VCC pin to 5V on the board
- SIG output voltage pin to pin 34 on the board
- GND pin to GND on the board
The soil moisture sensor
The soil moisture sensor is one of the most important sensors in this project. It is going to let me know if the soil of my plant is wet or dry, and it is going to help me figure out when to water it.
Pinout:
- VCC pin to pin 17 (I am not using the vcc pin to prevent corrosion)
- SIG output voltage pin to pin 16 on the board
- GND pin to GND on the board
The HC-SR04 ultrasonic distance sensor
The ultrasonic sensor uses sonar to determine distance to an object. It has high accuracy and stable readings in a range from 2 cm to 400 cm. I am using this sensor to measure the height of my plant.
Pinout:
- VCC pin to 5V on the breadboard
- TRIG pin that sends the signal to pin 25 on the board
- Echo pin that receives signal to pin 26 on the board
- GND pin to GND on the breadboard
The programming
Once I had my sensors and development board ready, I started with writing a program that is going to retrieve data from the sensors and send it to the Graphite and Loki database. I am using an Arduino IDE to upload the program to the development board. Therefore, as a first step, I have connected my ESP32 board with all sensors through a microUSB to my computer.
Step 1: Setting up Arduino IDE to support your ESP32 board
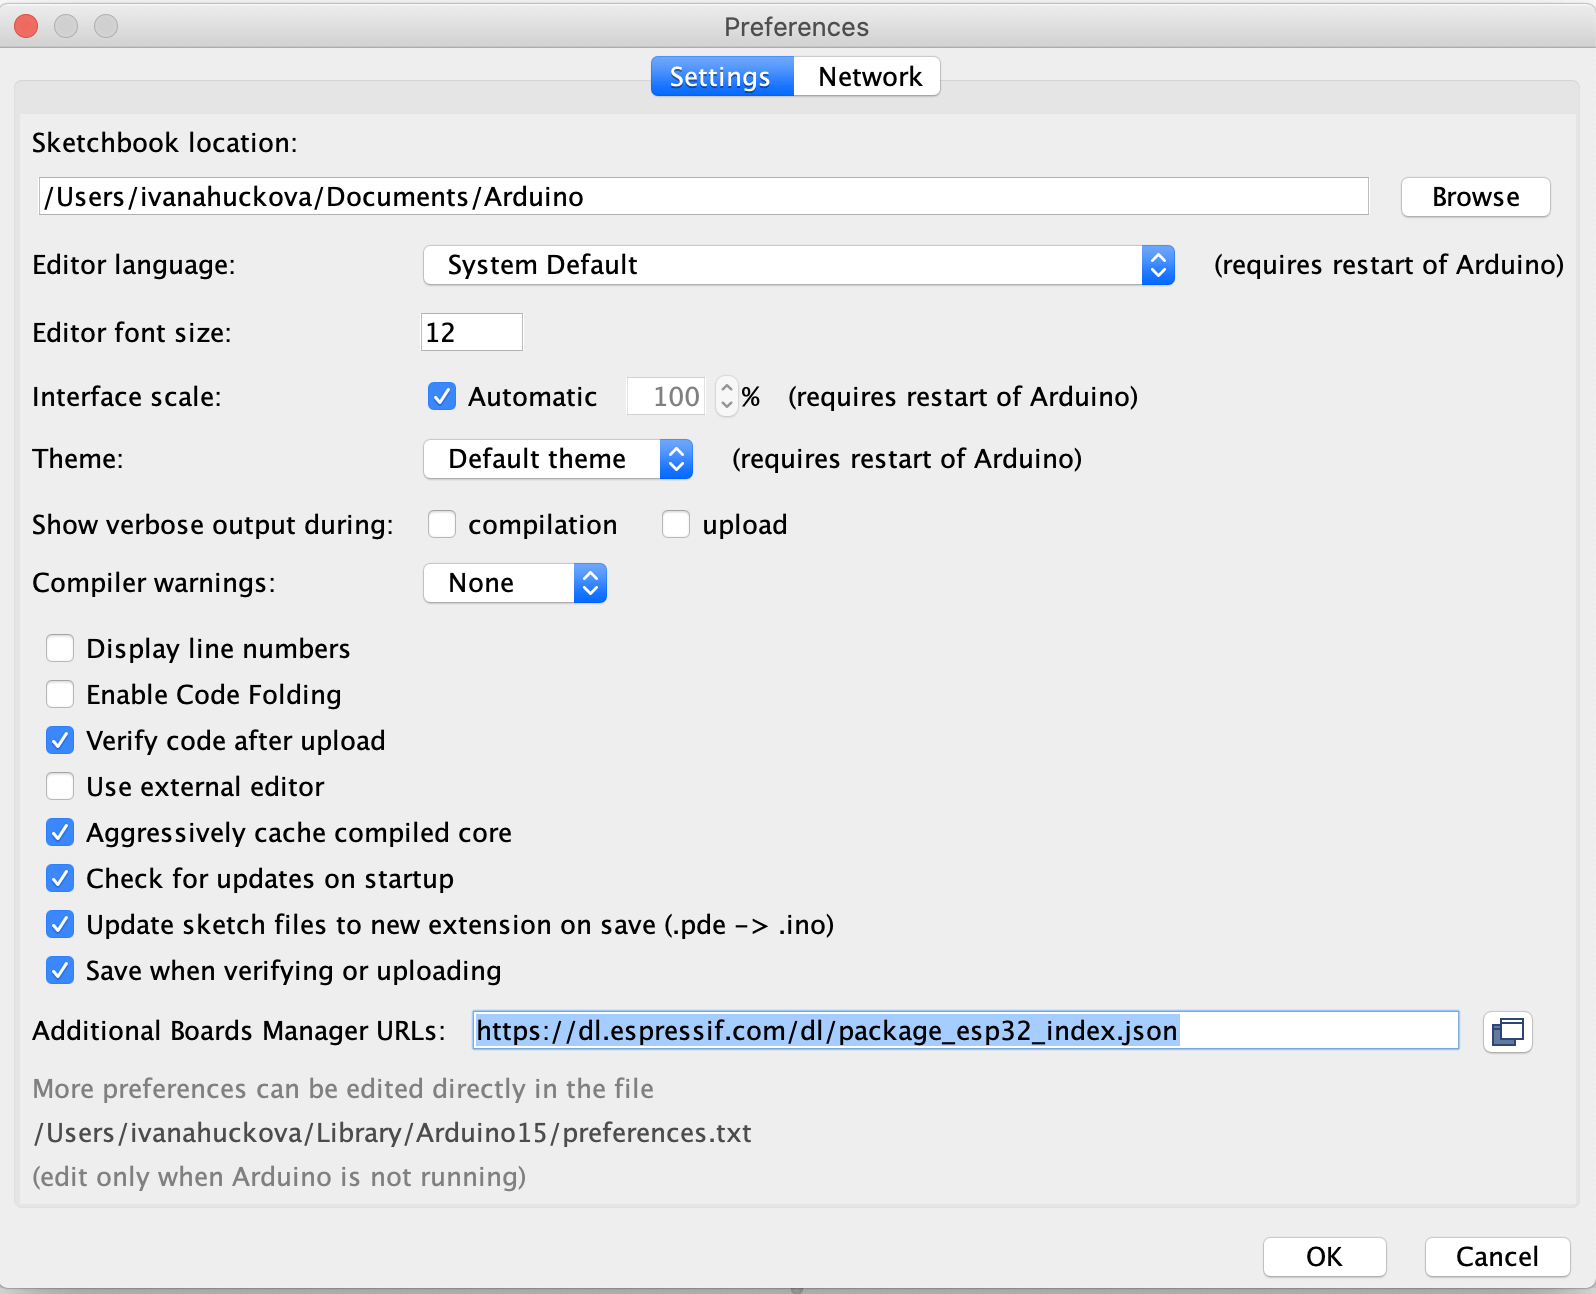
After my ESP32 board is connected to my computer, I continue with opening my Arduino IDE. As I am using an ESP32 board (and not an Arduino board), I need to add a board definition that adds support for my EP32 board. In Arduino > Preferences, I have added the url https://dl.espressif.com/dl/package_esp32_index.json to the Additional Boards Manager URLs input. This open source board definition adds support for programming ESP32 boards.
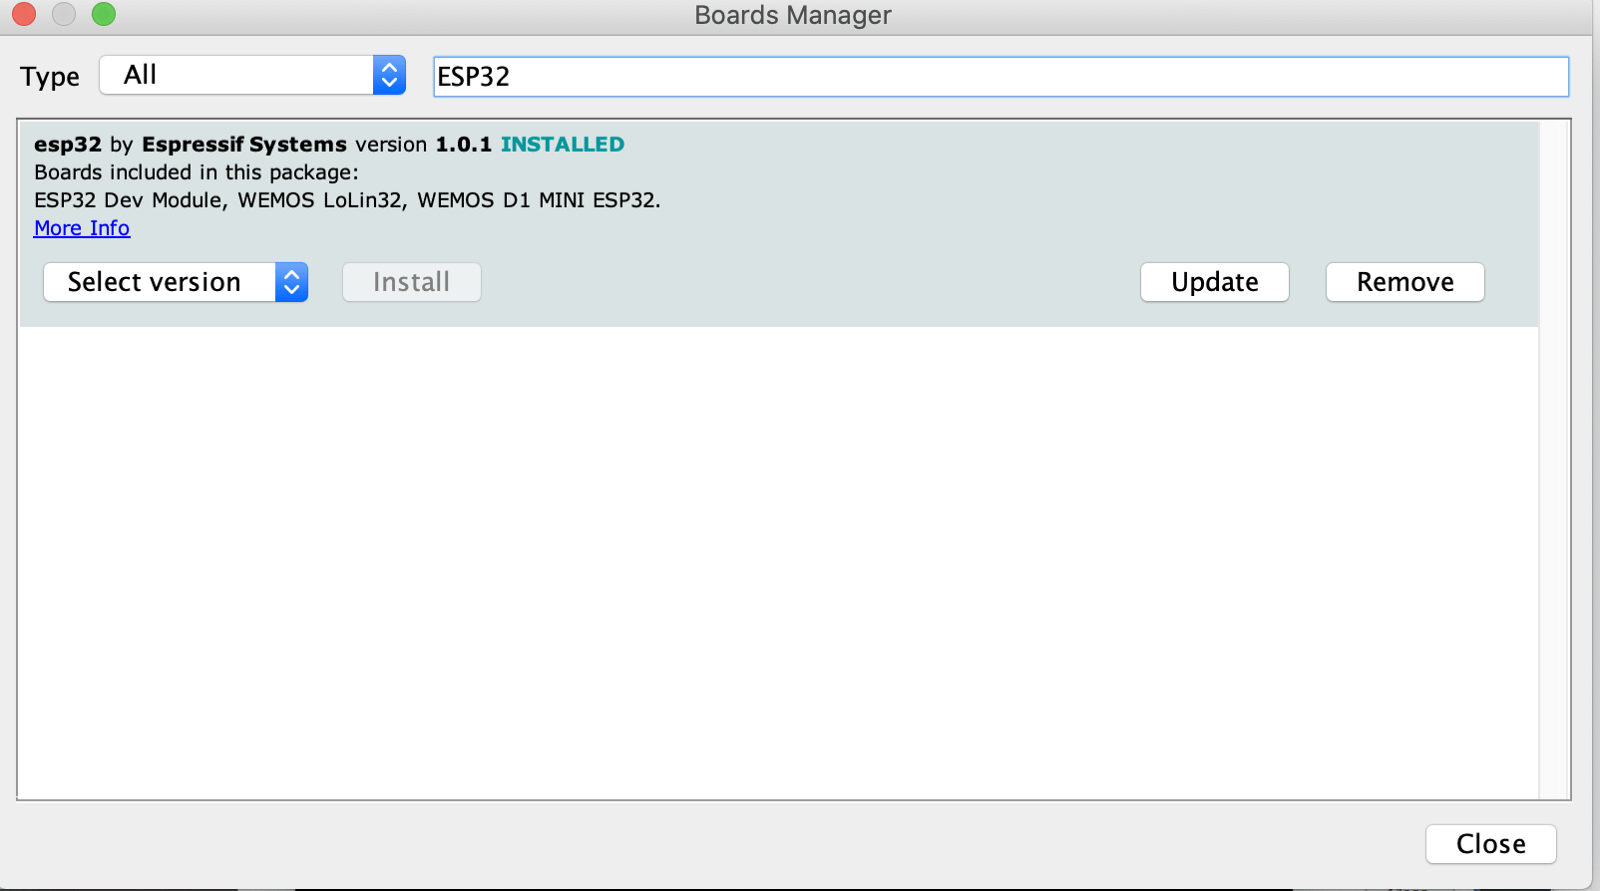
Then, in Tools > Boards > Boards Manager I have added ESP32 board manager.
Lastly, in Tools > Boards, I have chosen DOIT ESP32 DevKit. This tells the Arduino IDE which profile and base libraries to use when compiling the firmware image, and how to flash it to the board. Make sure that in the Tools > Port submenu, you’ve selected the new COM port.
Step 2: Adding libraries
For this project, I used the following libraries:
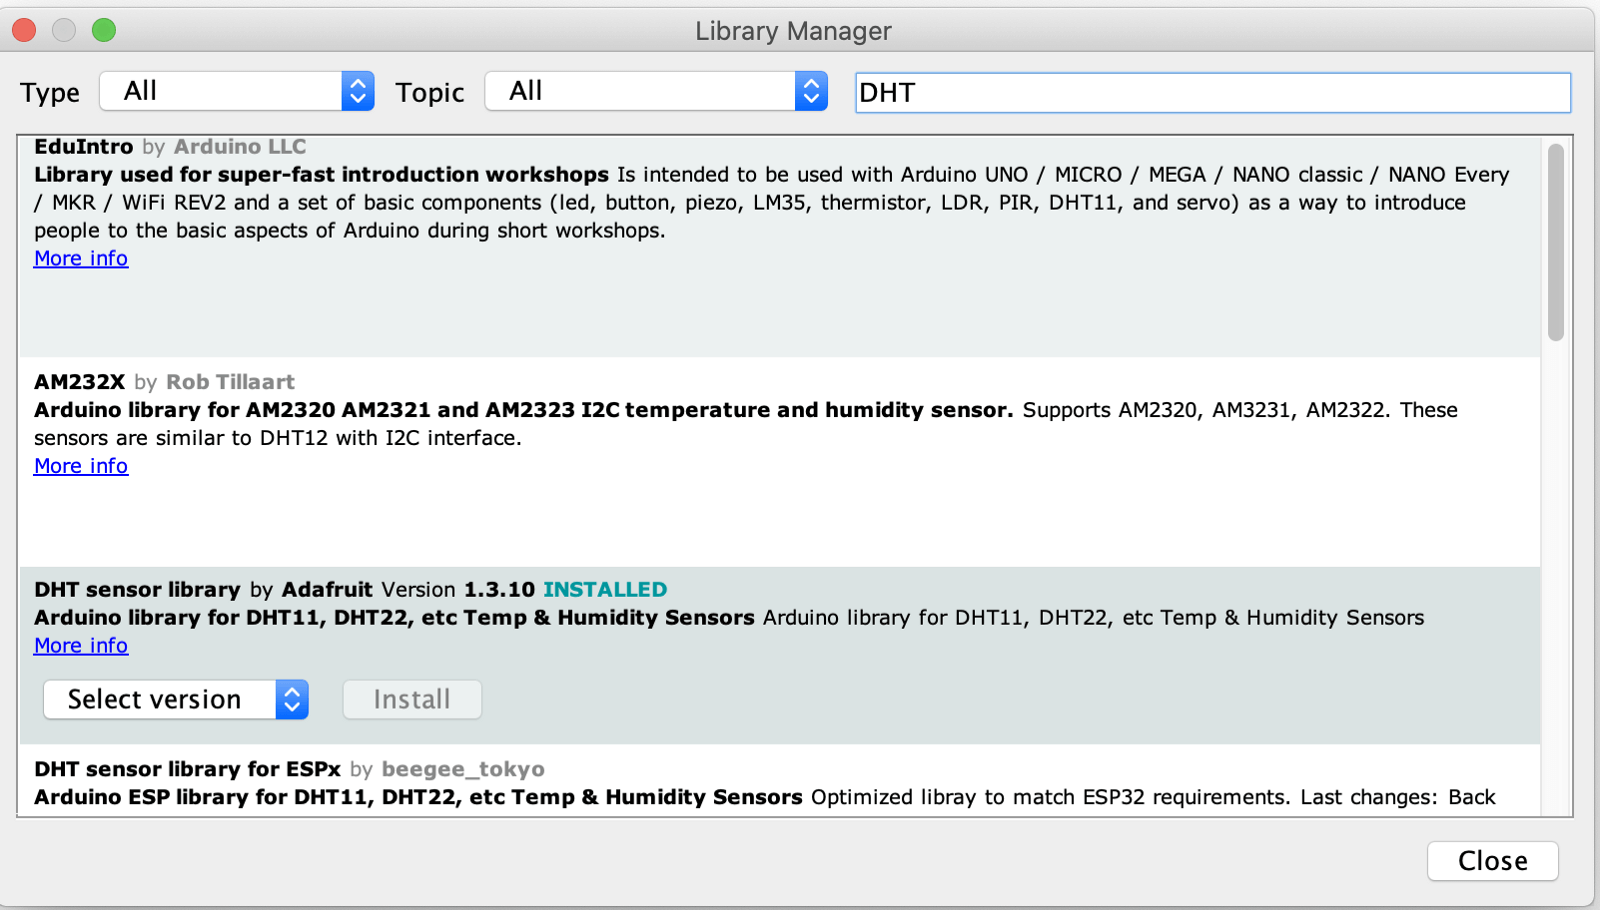
- DHT sensor library by Adafruit
- Adafruit Unified Sensor by Adafruit
- NTP Client by Fabrice Weinberg
- HCSR04 by Martin Sosic
I installed all of these libraries in Sketch > Include Library > Library Manager. It is important to have these libraries installed before moving to the next steps.
Step 3: Create a program
Arduino natively supports a language called the Arduino Programming Language (APL), which is basically a framework built on top of C++. A program written in APL is called a sketch and has the .ino extension. Every Arduino program has to have two special functions that are a part of every sketch: setup() and loop(). The setup() is called once, when the sketch starts. The loop() function is called over and over and is the heart of most sketches.
The full sketch can be downloaded on my GitHub. In the repo, there are two important files : avocado_monitoring.ino and config_template.h. The first file includes the program with detailed comments describing what each section does. In the second one, I am storing my variables and API keys. If you decide to create your own monitoring system, download the repo, rename config_template.h to config.h, and replace your variables and API keys.
Step 4: Uploading and running the program to ESP32
Now it is time to upload the program to the ESP32 board! It is as easy as opening the avocado_monitoring.ino file in Arduino IDE and pressing the Upload button (the arrow pointing to the right).
After everything was set up correctly, I was soon able to see the incoming data to my Graphite and Loki database.
Visualize the data in Grafana
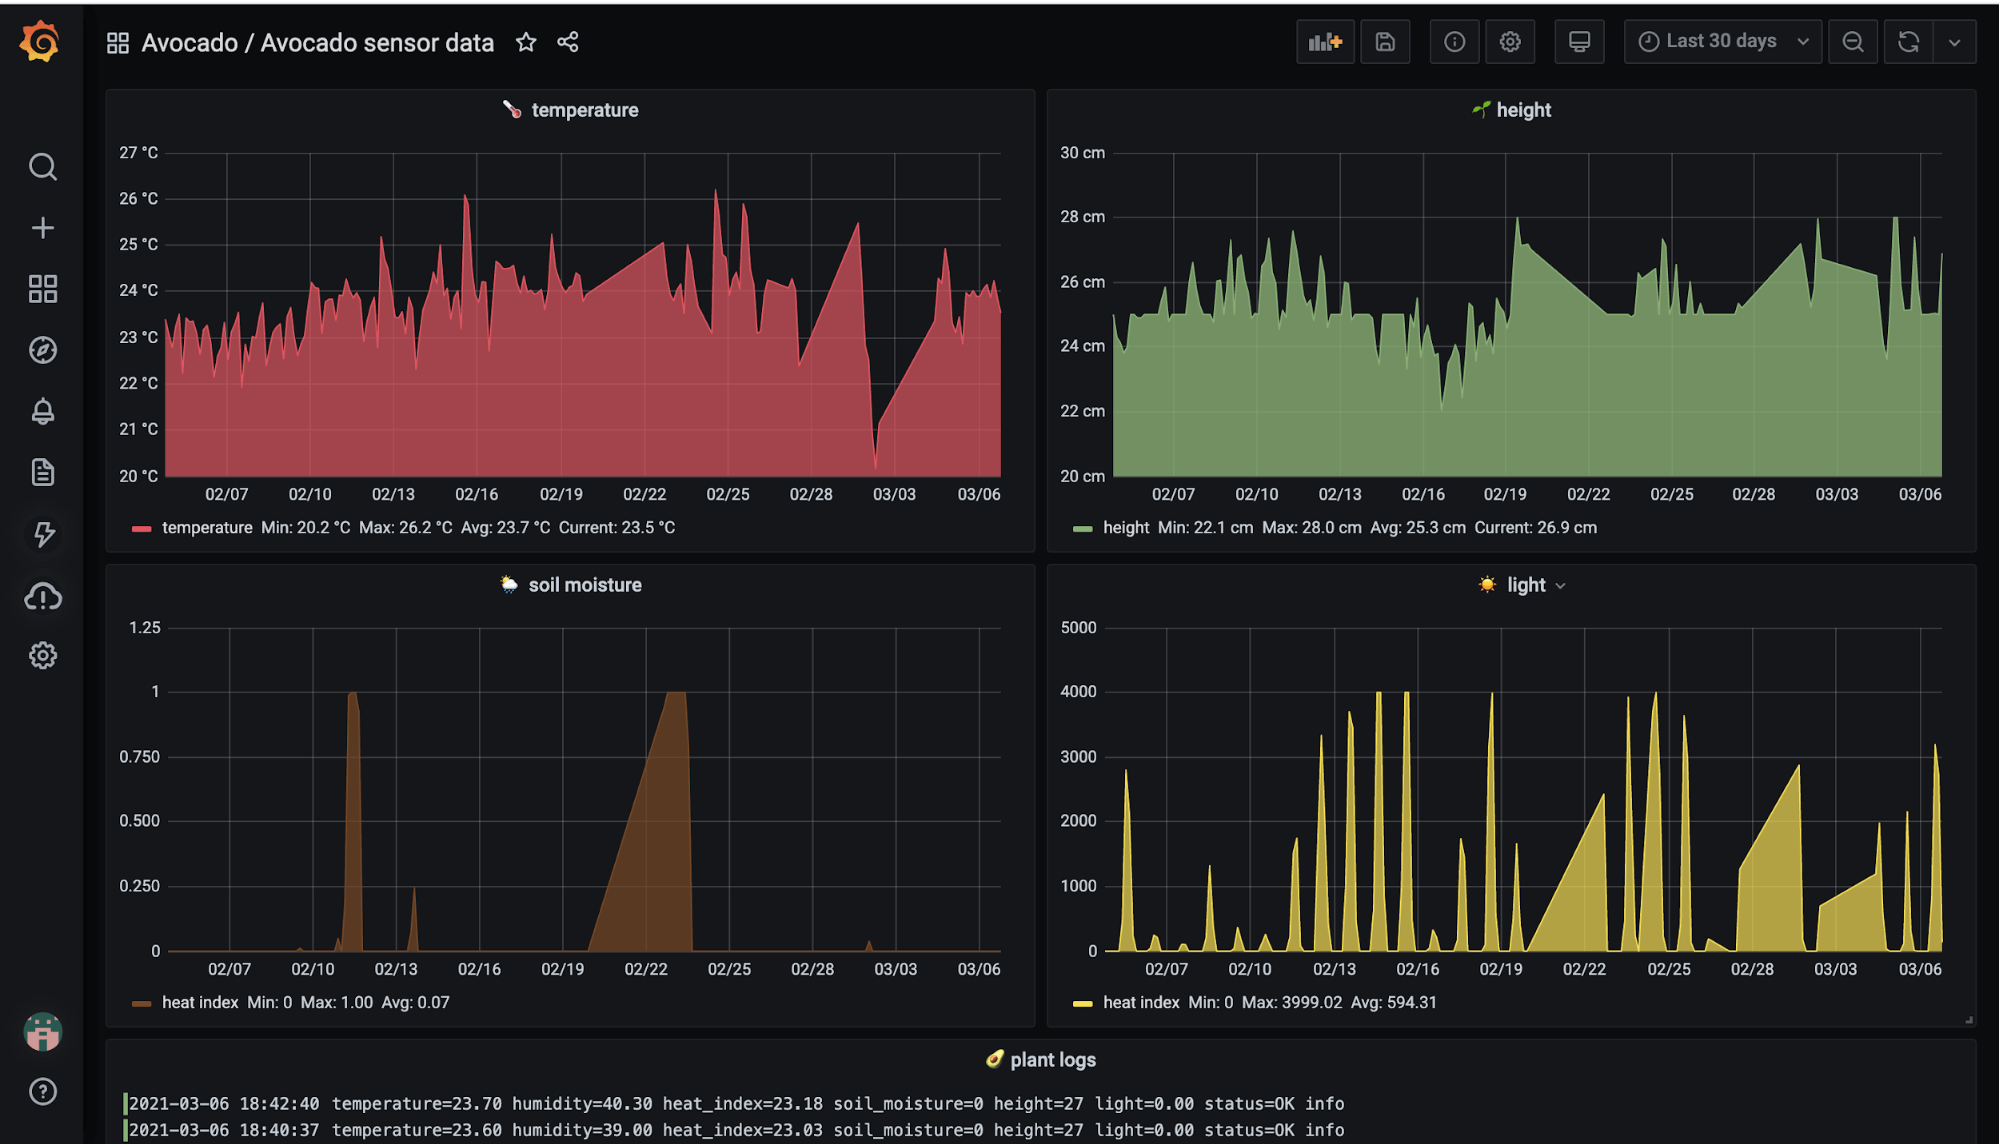
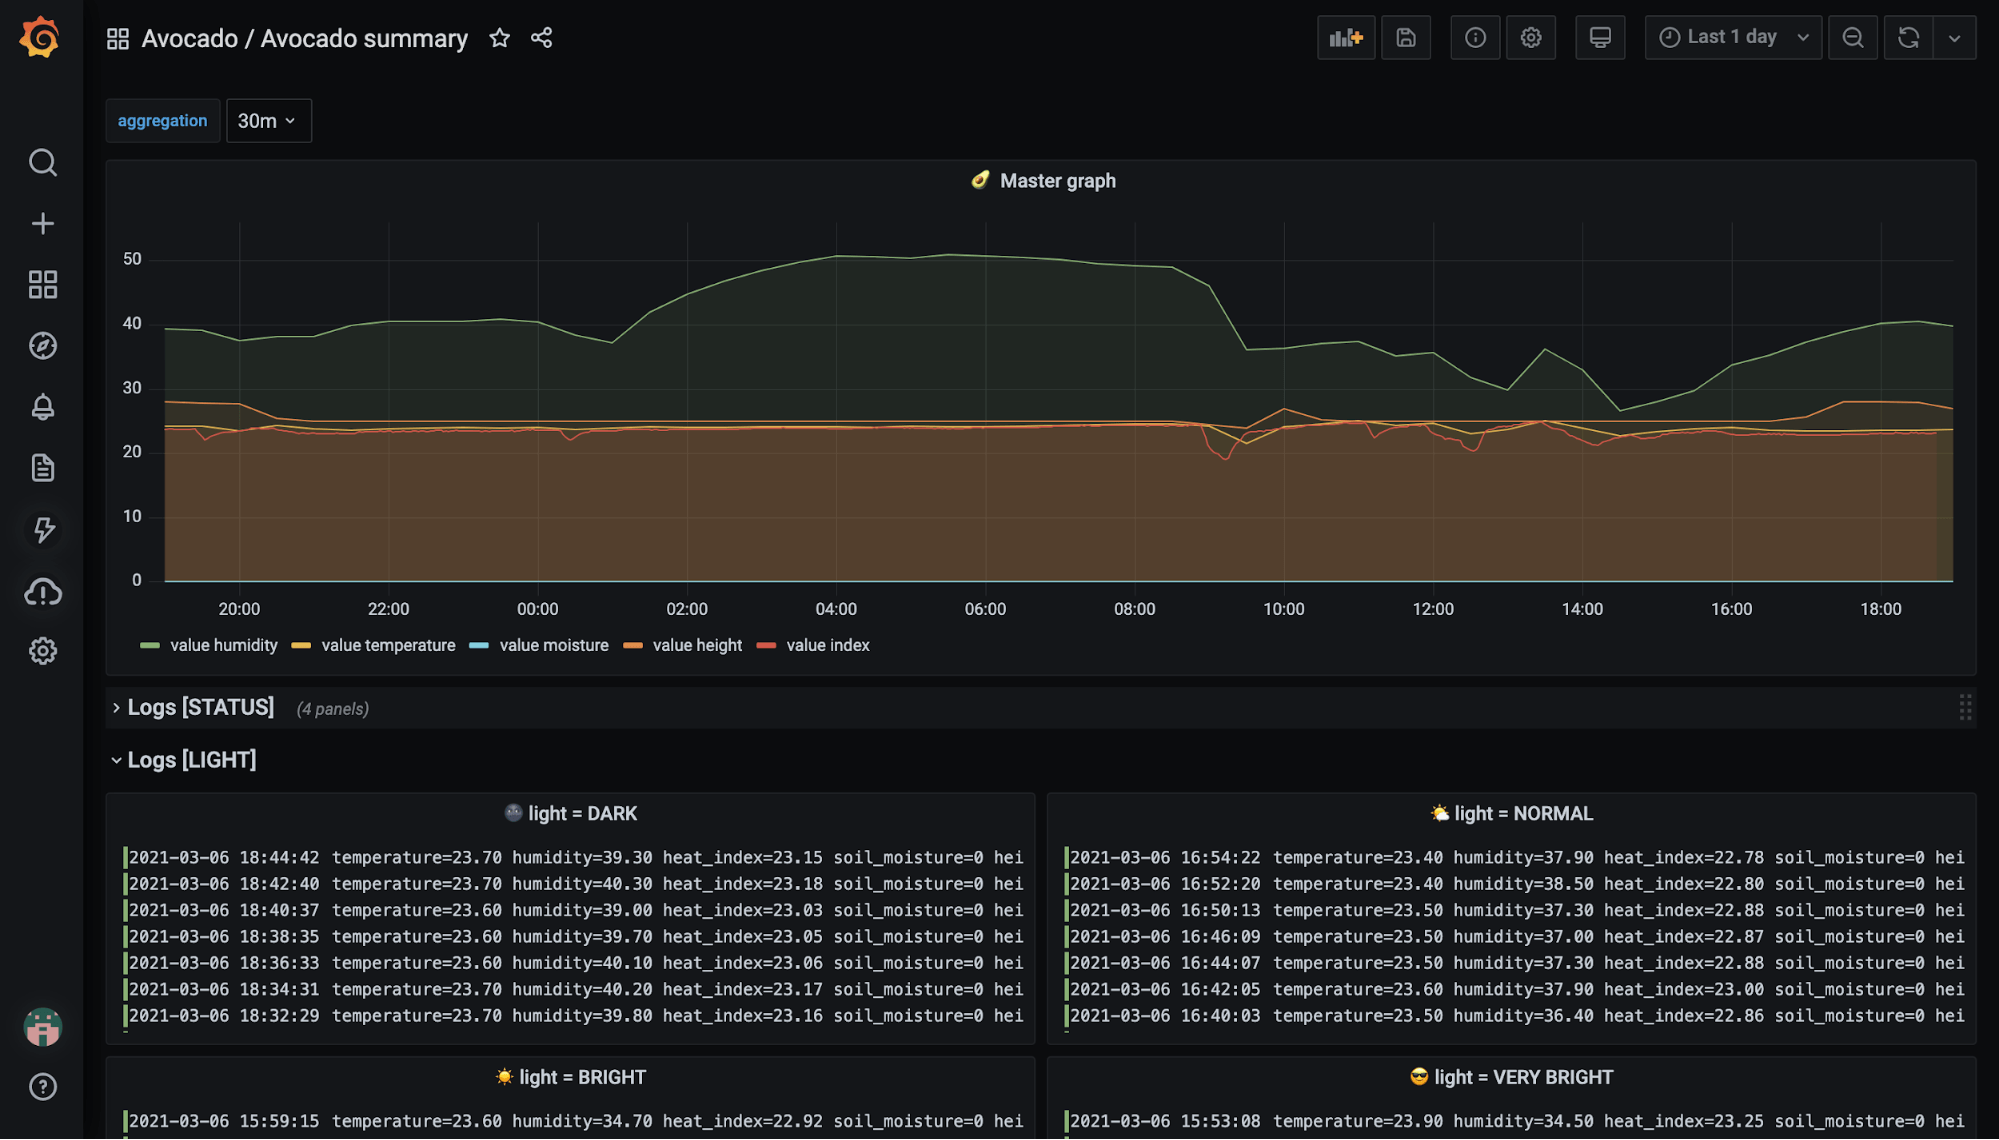
As soon as the data from monitoring is flowing to Graphite and Loki, it’s time to visualize them in Grafana. I opened the Grafana instance that was set up through my Grafana Cloud signup and started to create dashboards. I created two dashboards, and if you would like to use the same ones, you can just go and copy-paste my dashboards’s JSON models in here and here.
Add the monitoring system to the plant stand
Now comes the last, handy part of the work. 👷♀️ I mounted my monitoring system on the plant stand using a glue gun, but feel free to improvise and design your own solution.
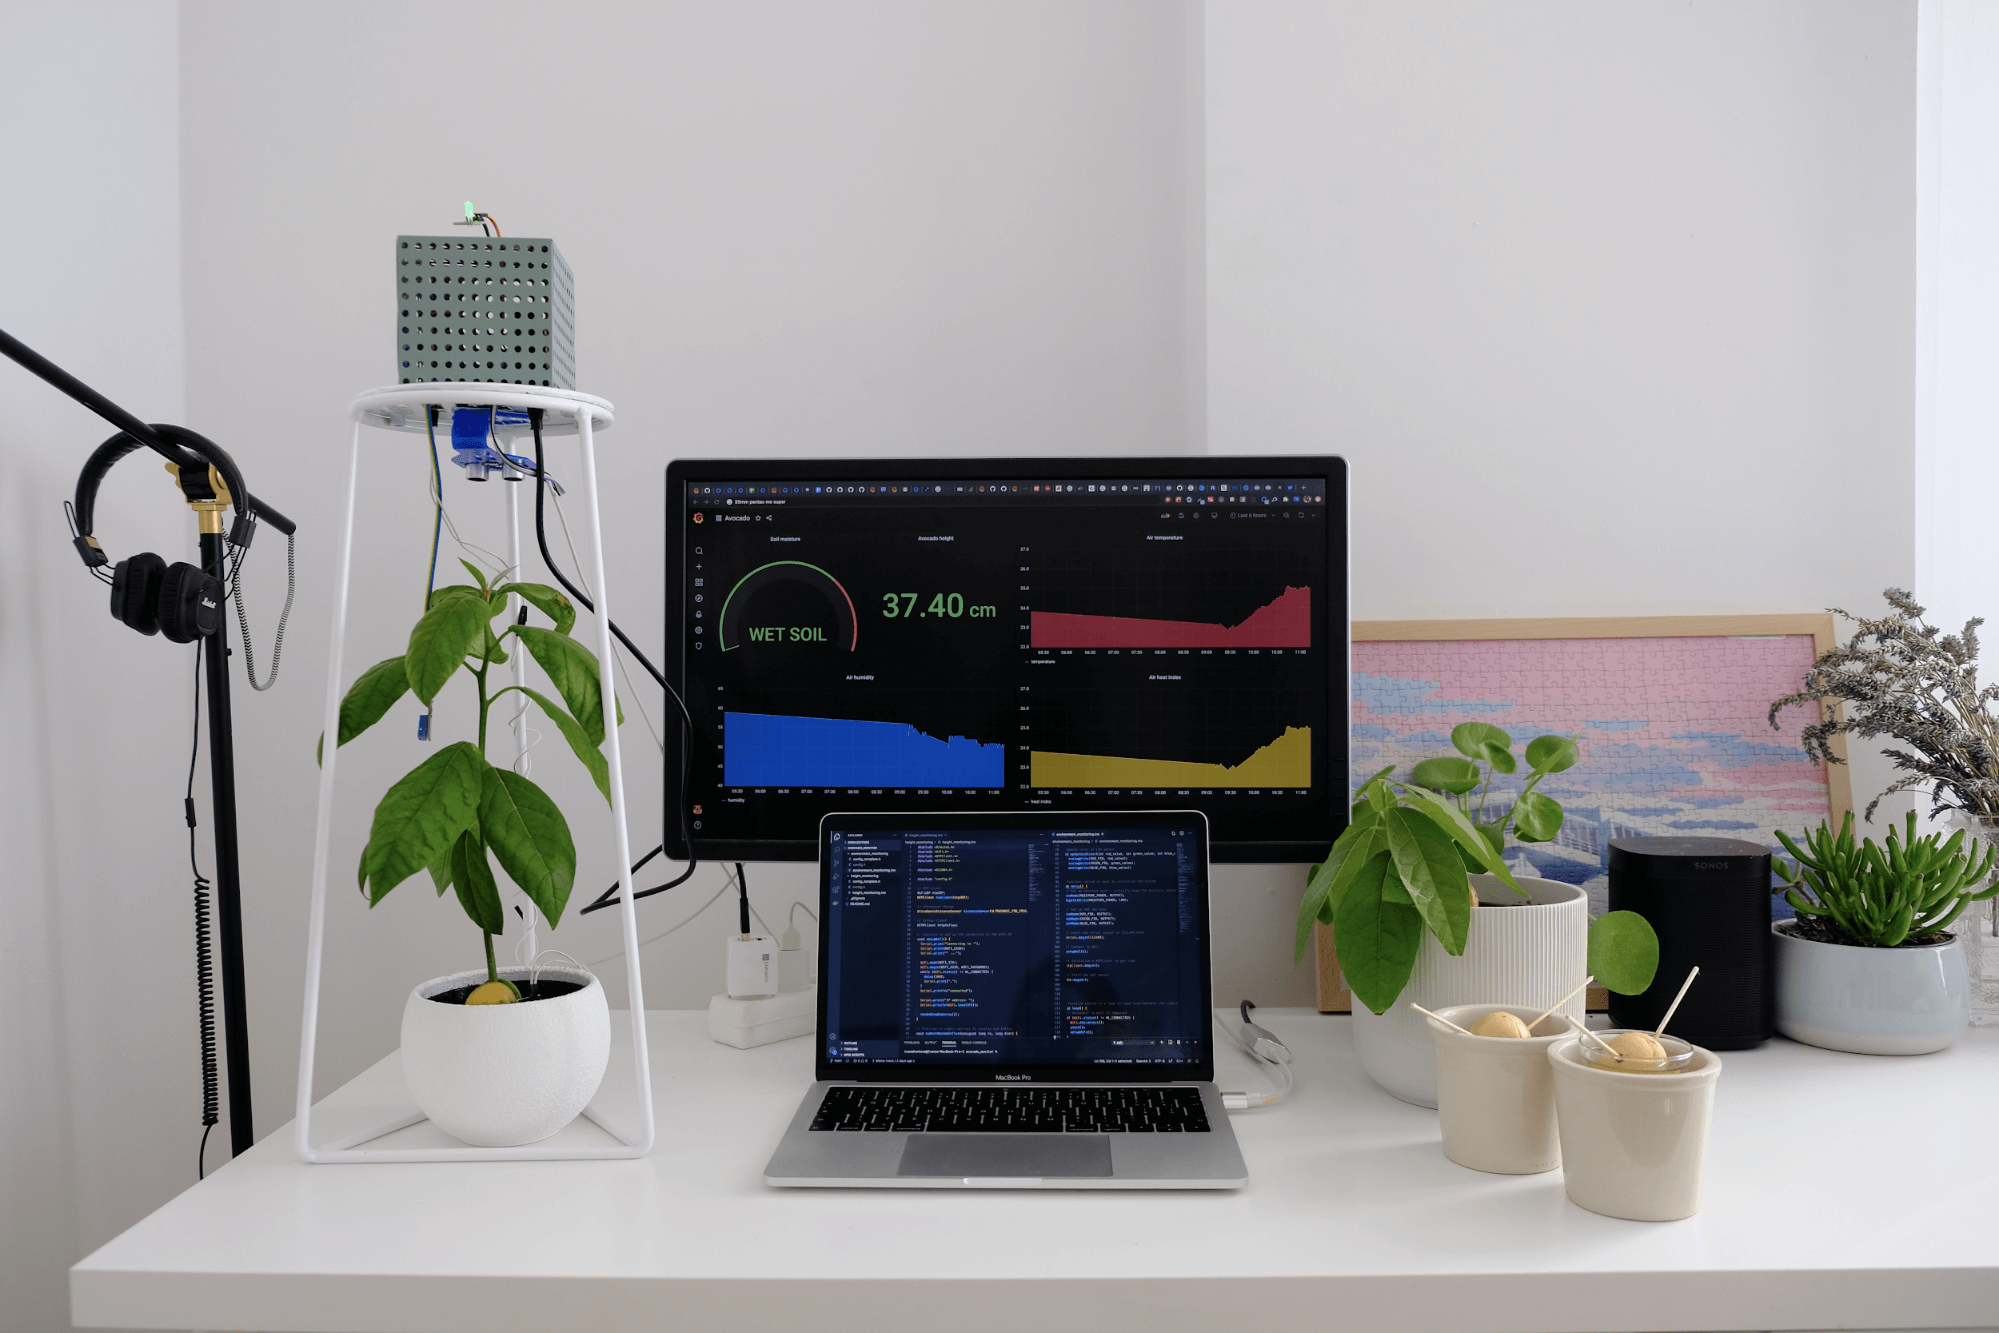
With this blog post, I wanted to show that it doesn’t have to be difficult or complicated to create a monitoring system for basically anything. I hope you’ll try this out and let me know how it goes. Or if you decide to build a different monitoring system or IoT project, I would absolutely love to hear about that too!


