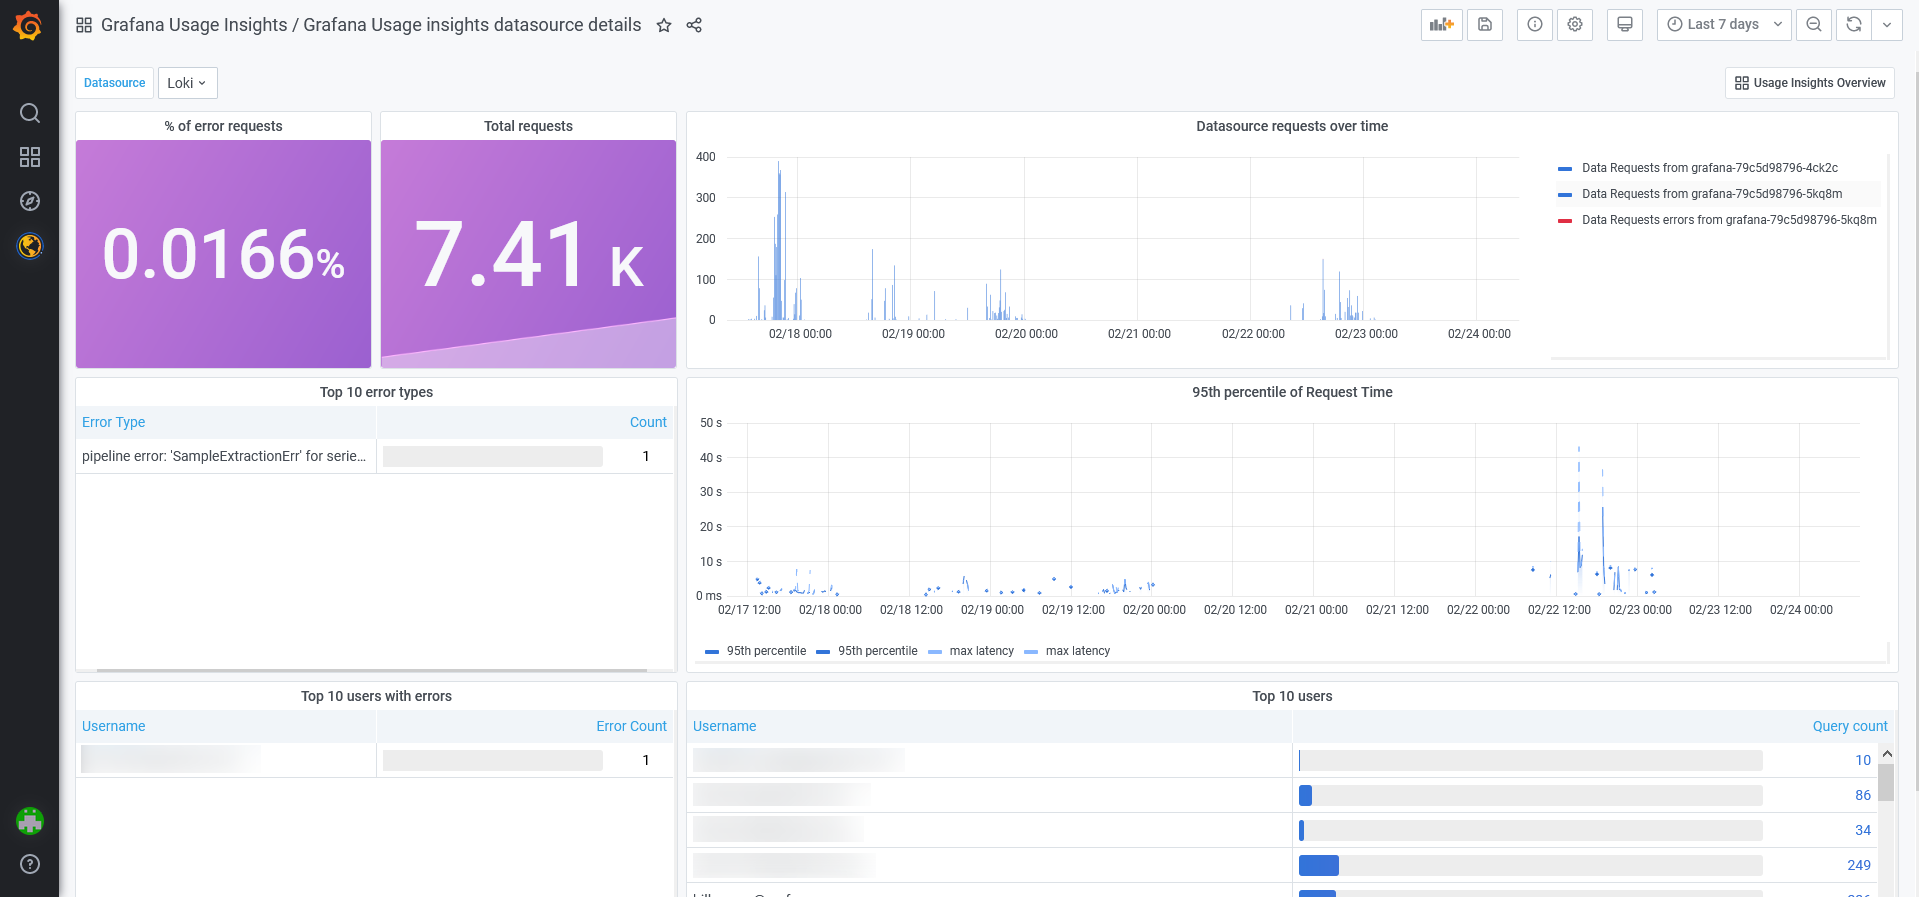
New in Grafana 7.4: Export usage data to Loki to help manage dashboard sprawl and troubleshoot faster
We first released the usage insights Enterprise feature in Grafana 7.0 based on feedback from customers that they would like to better understand how their users are interacting with Grafana, including the dashboards they visit, the information they query, and where they run into issues.
What we learned was that dashboard sprawl is a real issue: Administrators estimate that almost 60% of dashboards might not be used at all.
More dashboards can also lead to inefficiencies, and usage insights can be a great starting point or workaround for fixing broken dashboards and data sources. With the improved dashboard sort, admins can focus on dashboards that encounter the most errors. And with data sources insights, showing all information about each data source in one place makes it easier for admins to take care of the most error-prone dashboards while also learning more about their usage.
But customers wanted more usage detail and customization options. While it is possible to visualize some usage insights as we just discussed, users didn’t have access to the raw data, so the possibilities were limited.
Enter Grafana 7.4. With the latest release, Grafana Enterprise customers can now export raw usage insights events as logs to Loki and use the data to make detailed dashboards that show how users are working in Grafana.

Logs include the details of each dashboard visit and data source query, so Grafana administrators can troubleshoot and help individual users faster. Admins can also organize and display the data that suit their needs, such as:
- Slowest queries (all or per data source)
- Most popular dashboards
- Top errors seen by users (all or per data source)
Admins will also be able to run ad hoc queries and build Grafana dashboards with no need for external tools or additional plugins. And for those who set up Grafana for high availability, they can easily access their information by host.
The usage data in Loki can also help identify the users within a network who excel at using Grafana in different capacities. Admins are often treated like experts in all things related to Grafana even though it’s not necessarily true. Usage insights can provide a greater understanding of who works a lot with or is adept with:
- A specific data source
- Dashboards
- Certain applications
For Grafana 7.0, we started with the usage insight features that are based on aggregated data and have no dependencies; however, we have always wanted to give customers access to these detailed logs. Once we internally developed a Loki exporter for audit logs, it made it much easier to extend the same support to the usage insights feature and allow exporting the usage insights raw data into Loki.

Learn more about Grafana Enterprise Logs
The release of this feature coincides perfectly with the launch of Grafana Enterprise Logs, a unique approach to log indexing, storage, and administration control built on Loki that allows companies to run it securely at scale. Everyone in an organization can access all of their relevant log data, and companies that have specific security policies or are in regulated industries can leverage the built-in Grafana interface to easily manage permissions and settings and grant individuals access to the resources they need without compromising cost.
I’d like to thank my colleagues Jon Gyllenswärd and Joan López de la Franca for their work on this feature and Michelle Tan and Mitch Seaman for their help with this blog post.
We will take a deeper dive into Grafana Enterprise Logs during a one-hour webinar on March 18. Register now for “Grafana Enterprise Logs: Logging with security and scale.”
You can also read more about Grafana Enterprise Logs, and contact us if you’d like to try it out!


