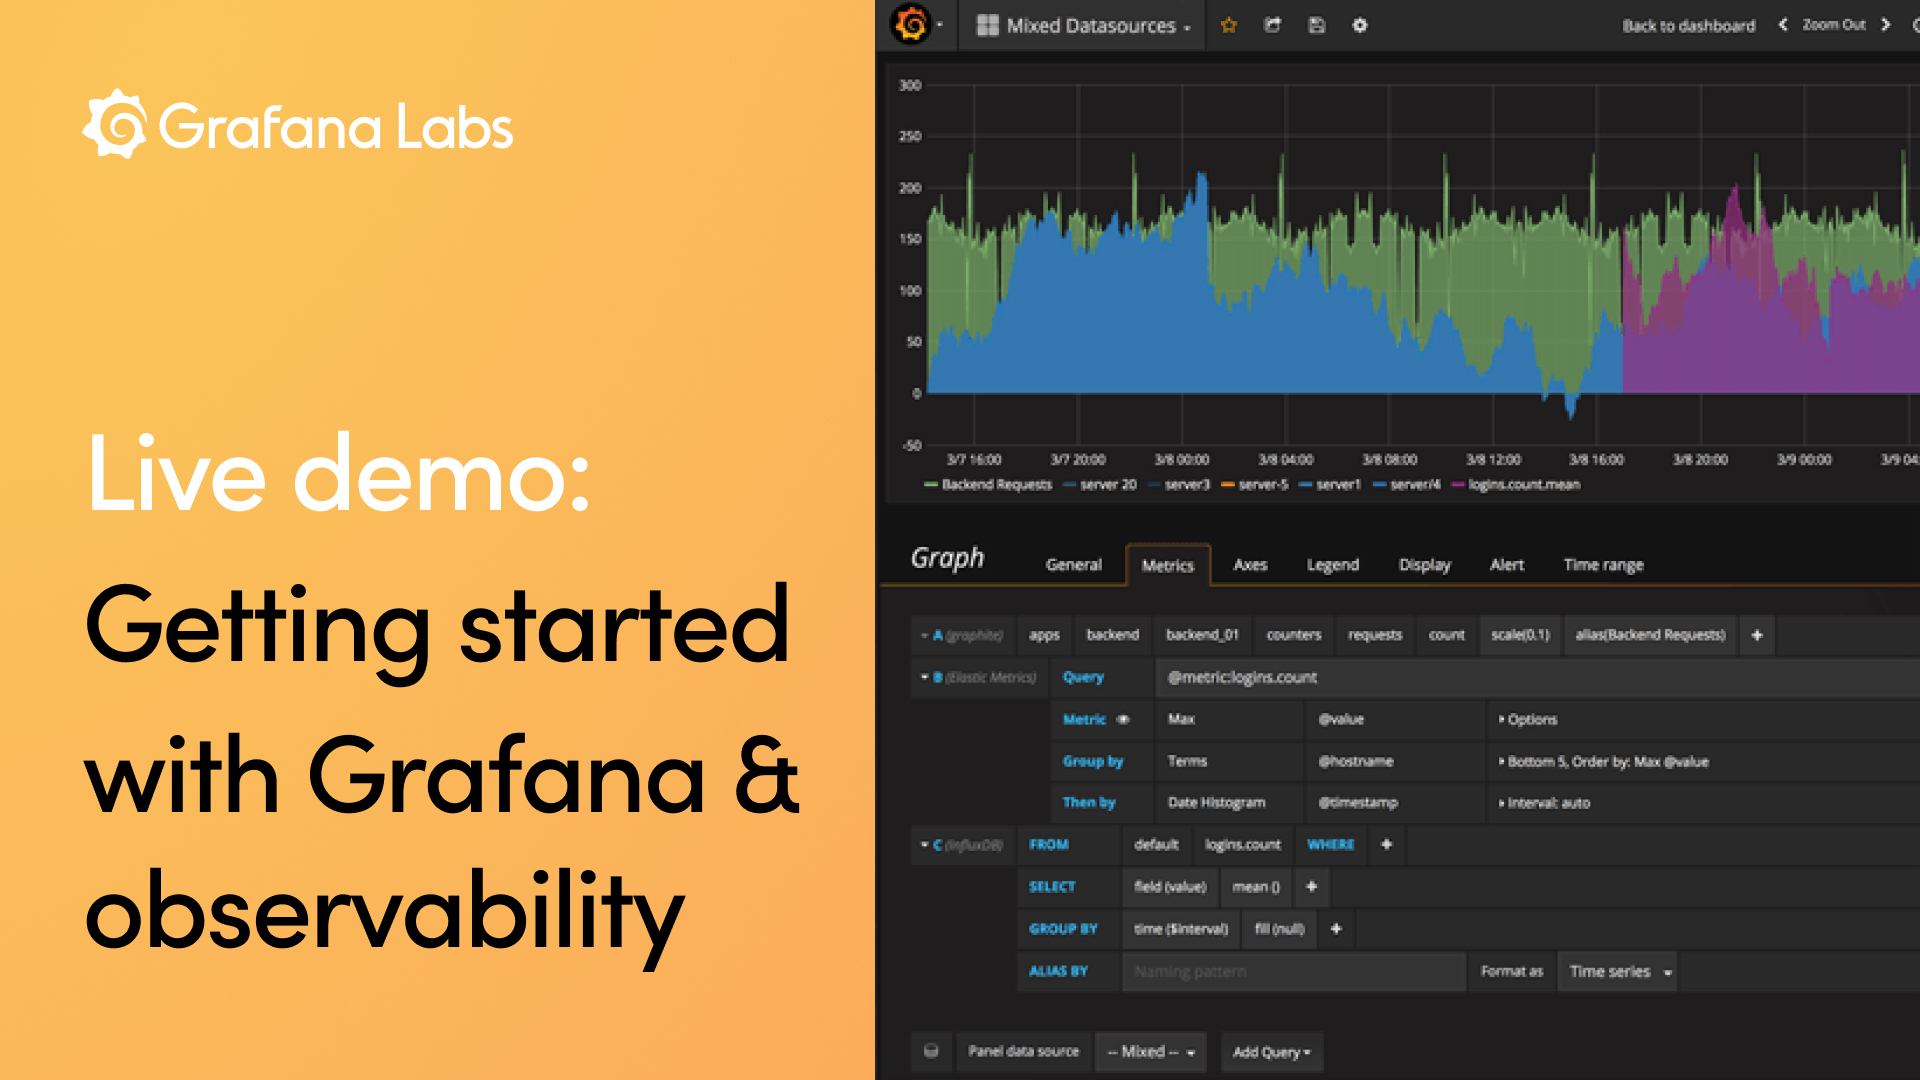
Don't miss our new series of live demo webinars kicking off March 4: Getting started with Grafana and observability
This week, we’re launching a monthly webinar series featuring 30-minute live demos led by members of the Grafana Labs solutions engineering team. On March 4 at 17:30 UTC, Vijay Tolani and John O’Brien will show you how to get started with the Grafana Stack, so you can go from zero to observability in just a few minutes.

Vijay and John will walk you through the Grafana user interface and demonstrate how to:
- set up monitoring for a web service that uses Prometheus and Loki to store metrics and logs,
- connect, explore, and correlate data in Grafana to gain valuable insights into your application,
- and alert on your data.
Sign up now for the “Live demo: Getting started with Grafana and observability” webinar on March 4. And let us know what else you’d like our solutions engineers to demo in upcoming webinars!
The easiest way to get started with Grafana, Prometheus, Loki, and Tempo for tracing is Grafana Cloud, and we’ve recently added a new free plan and upgraded our paid plans. If you’re not already using Grafana Cloud, sign up today for free and see which plan meets your use case.


