The new Splunk Infrastructure Monitoring plugin brings the SaaS formerly known as SignalFx to your Grafana dashboards
This post has been updated to reflect changes in the availability of the Splunk Infrastructure Monitoring data source plugin for Grafana Cloud users.
Greetings! This is Mike Johnson reporting from the Solutions Engineering team at Grafana Labs. In previous posts, you might have read our beginner’s guide to distributed tracing and how it can help to increase your application’s performance.
In this post, we are back to talk about metrics and showcase another one of our newest Enterprise plugins: Splunk Infrastructure Monitoring (formerly known as SignalFx)!
If you have a “four nines’’ SLA for your business-critical application, time is of the essence. Supporting a 99.99% availability target means that there are only 4.38 minutes of downtime to spare on a monthly basis. Even worse, maintaining those SLAs is becoming even harder when your application resides on Kubernetes, where the workloads perhaps live only a few minutes and the interactions between the application’s microservices are complex. To top it off, your mission-critical application may even rely upon third-party APIs! From an observability perspective, the timeliness of metrics and analytics is critical, and automated triage and remediation is a must. That is where SignalFx would come into play.
SignalFx provides real-time monitoring and metrics for cloud infrastructure, microservices, and applications.
To help speed time-to-resolution, SignalFx promotes:
- Metrics at high resolution, down to one second.
- Real-time analytics, so you can create composite metrics to model your KPIs and alert on those composite metrics in real time.
Back in August 2019, Splunk acquired SignalFx, and today, SignalFx is an integral part of the Splunk Observability suite, rolled into the Splunk Infrastructure Monitoring product. We’ve officially renamed the plugin to reflect this, but please note that some references to SignalFx remain in the product and in this blog. :-)
With the Splunk Infrastructure Monitoring plugin for Grafana, which is available for users with a Grafana Cloud account or with a Grafana Enterprise license, you can leverage everything you love about SignalFx/Splunk Infrastructure Monitoring while still centrally visualizing your other data sources side-by-side. The outcome? That flexible, single-pane view of the underlying metrics that measure the health of your systems and applications to quickly correlate and debug for reduced MTTR.
Getting started with Splunk Infrastructure Monitoring
Setup is very simple and straightforward. First, you will need to download and install the plugin itself from our plugins page.
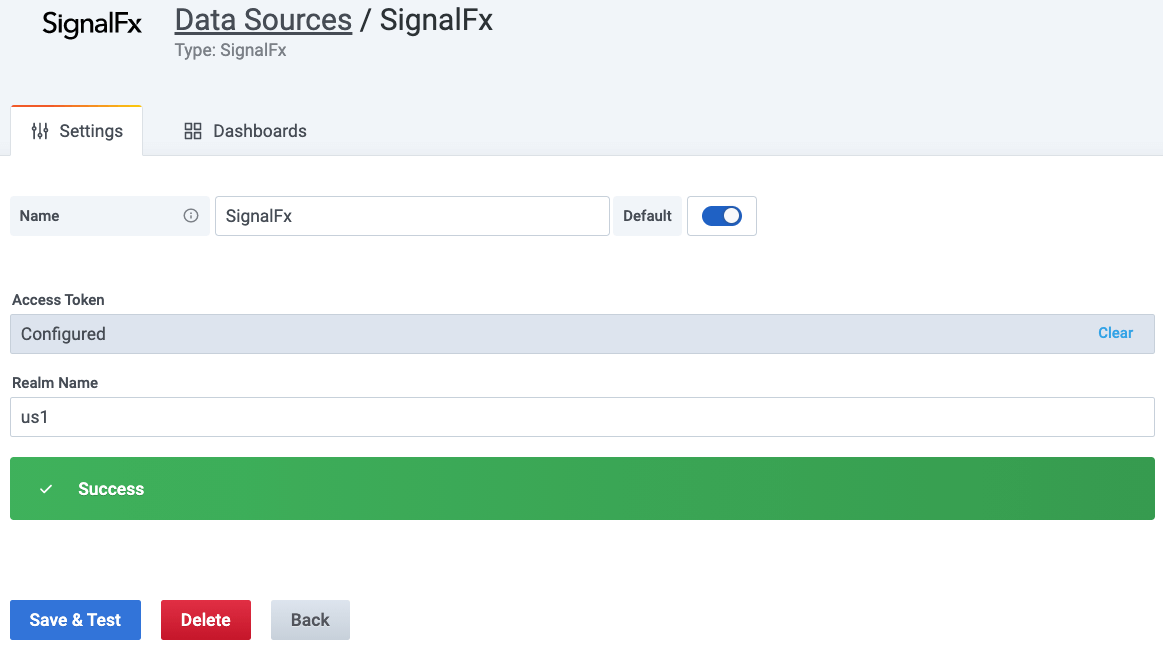
Next, you will create your Splunk Infrastructure Monitoring data source in Grafana by going to Configuration > Data Sources > Add data source. In order to configure your data source, you need your realm name and your SignalFx access token. Your realm can be found as a component of your SignalFx URL. Since my URL is https://app.us1.signalfx.com/, my realm name is us1. There are others, such as eu0. You can find your SignalFx access token by clicking on your avatar in the upper right of the SignalFx UI, then Organization Settings, and then Access Tokens. Under token Default, you will see a link that says Show Token.
In the end, your plugin configuration should look as simple as this:

You are now ready to go!
SignalFx sample dashboard
To start learning how SignalFlow has been implemented in this plugin, I first took a look at the SignalFlow queries within the example dashboard.
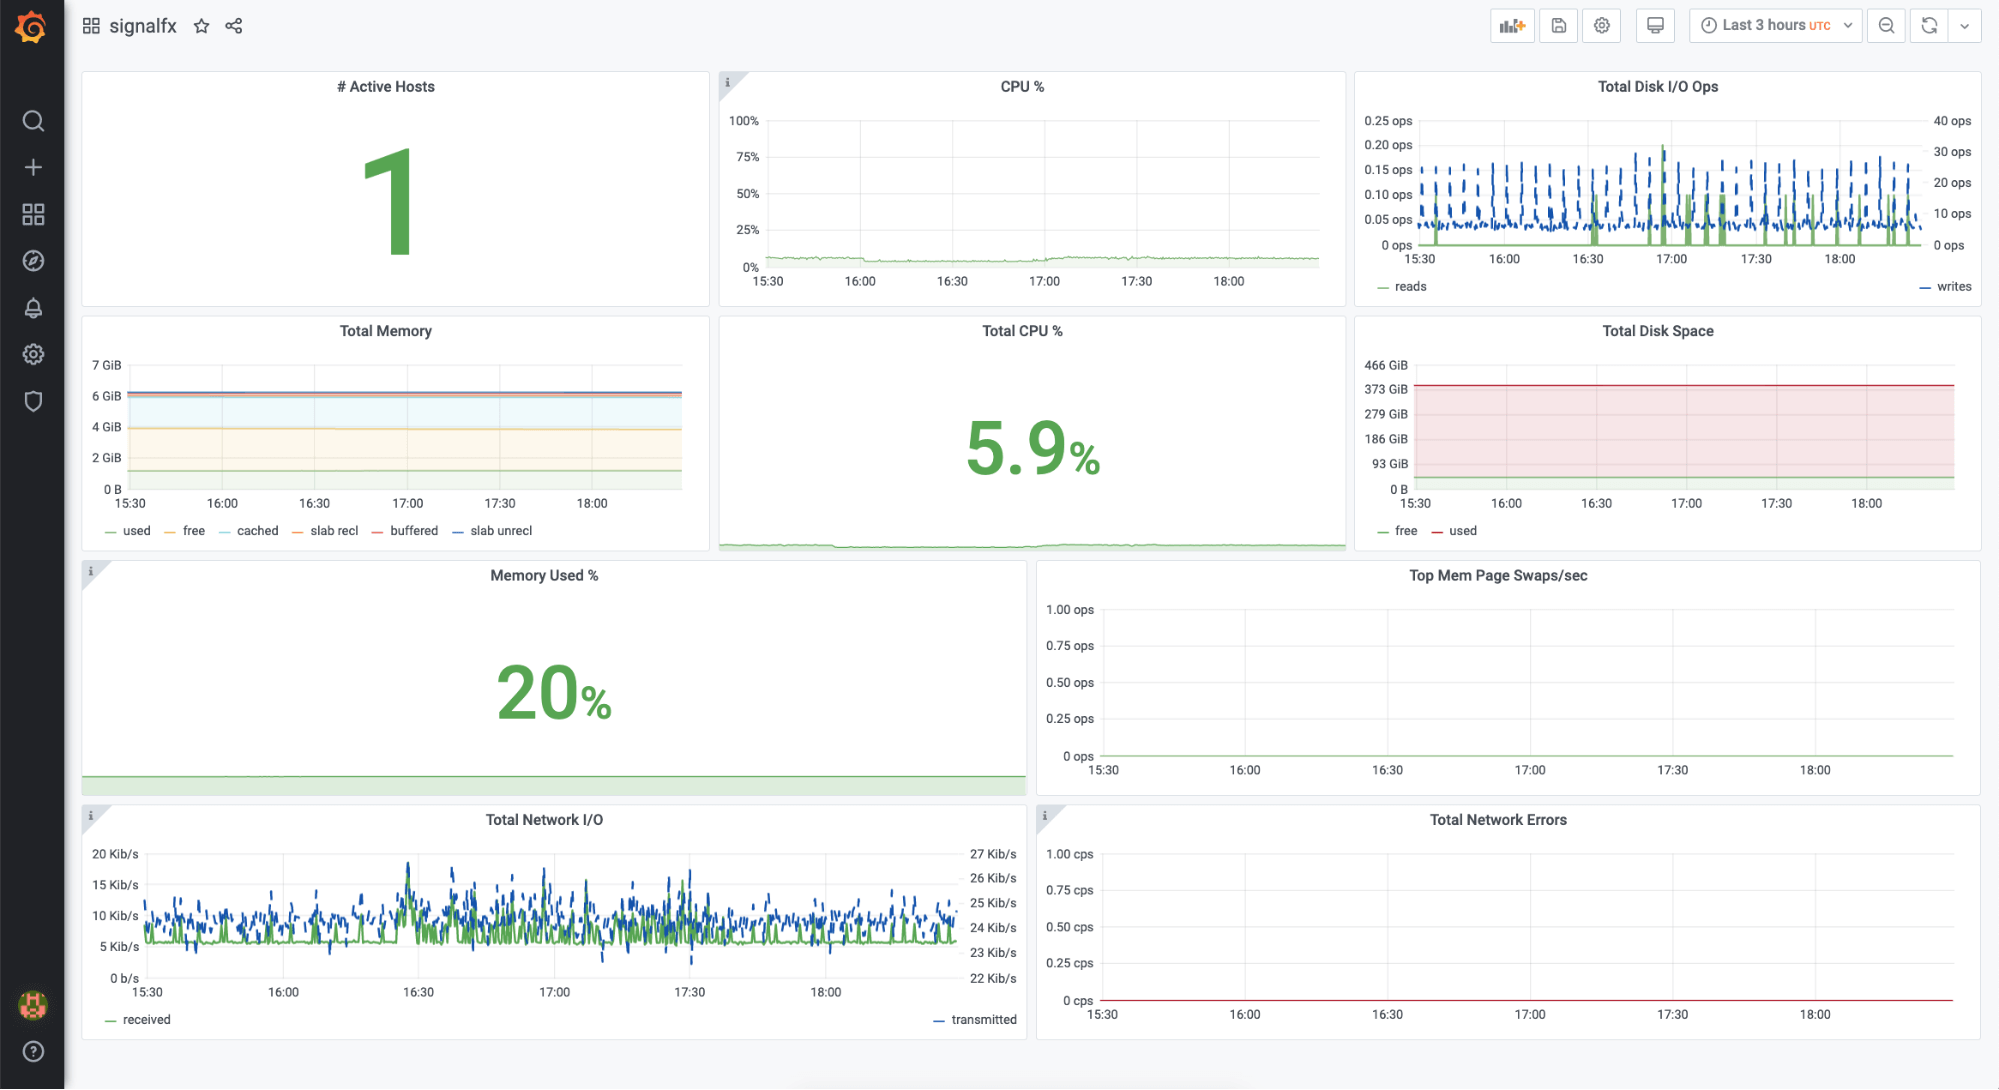
To populate data on the example dashboard, you need to be monitoring one or more hosts. In my test, I leveraged SignalFx’s one-line install (URL for the setup page on realm us1 is here). The single command auto-detects your OS, installs a collectd agent, and leverages your SFx access token so that the metrics automagically start flowing to the SFx SaaS service. My dashboard looks like this:

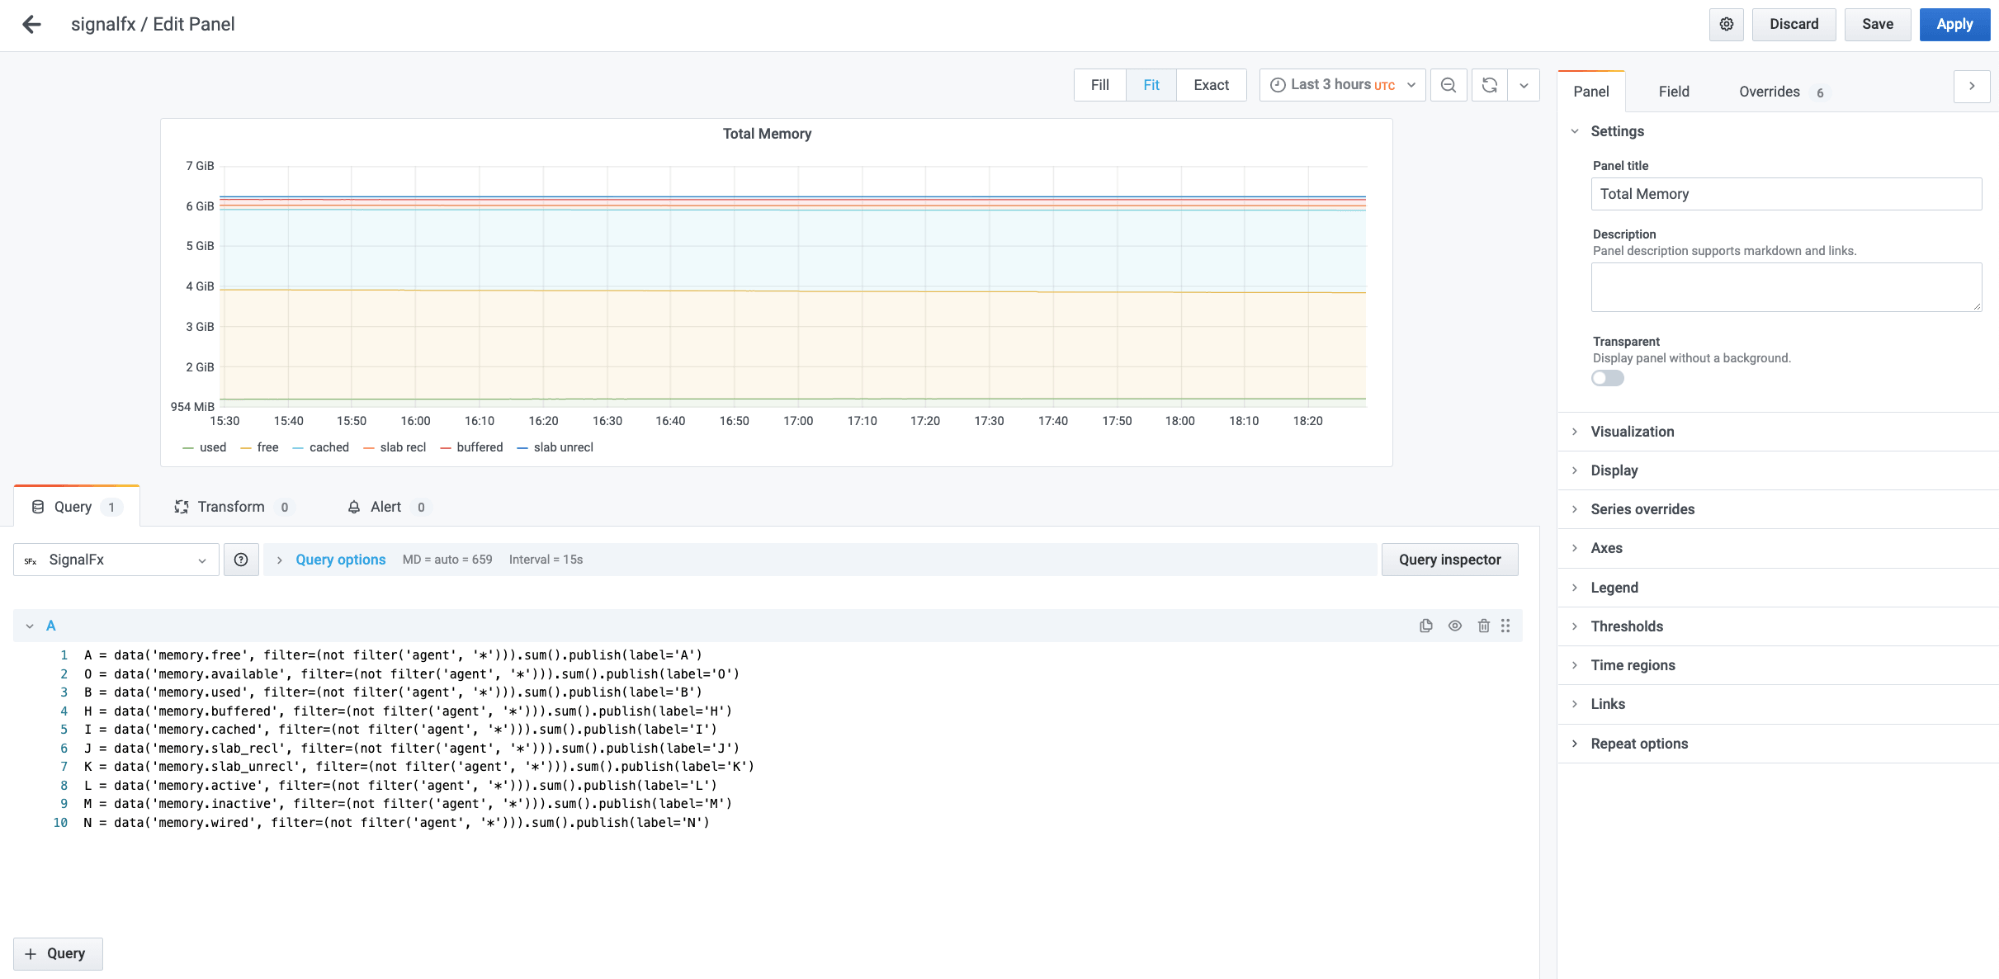
Opening up the Total Memory graph, I see that the query is a traditional, multi-line SignalFlow query.

Bringing Kubernetes-centric SignalFlow queries into Grafana
Earlier today, I had wanted to see some metrics on my Kubernetes cluster using SignalFx. So I followed the SignalFx helm chart instructions (on realm us1, they are here). It was quite straightforward and took only a couple of steps to complete.
Now, I would like to see those metrics in Grafana. Instead of browsing SignalFx’s metrics search capability, I decided to take the easy route and copy-paste the SignalFlow queries that the SignalFx team has already built. To see the SignalFlow query for one of the graph panels in the SignalFx UI, I clicked on the title of the graph. This brings you to the Plot Editor, where you choose the metric and add filters for your graph. To the far right on the plot editor is a View SignalFlow button. I copied each of these SignalFlow queries and pasted them into separate Grafana panels.
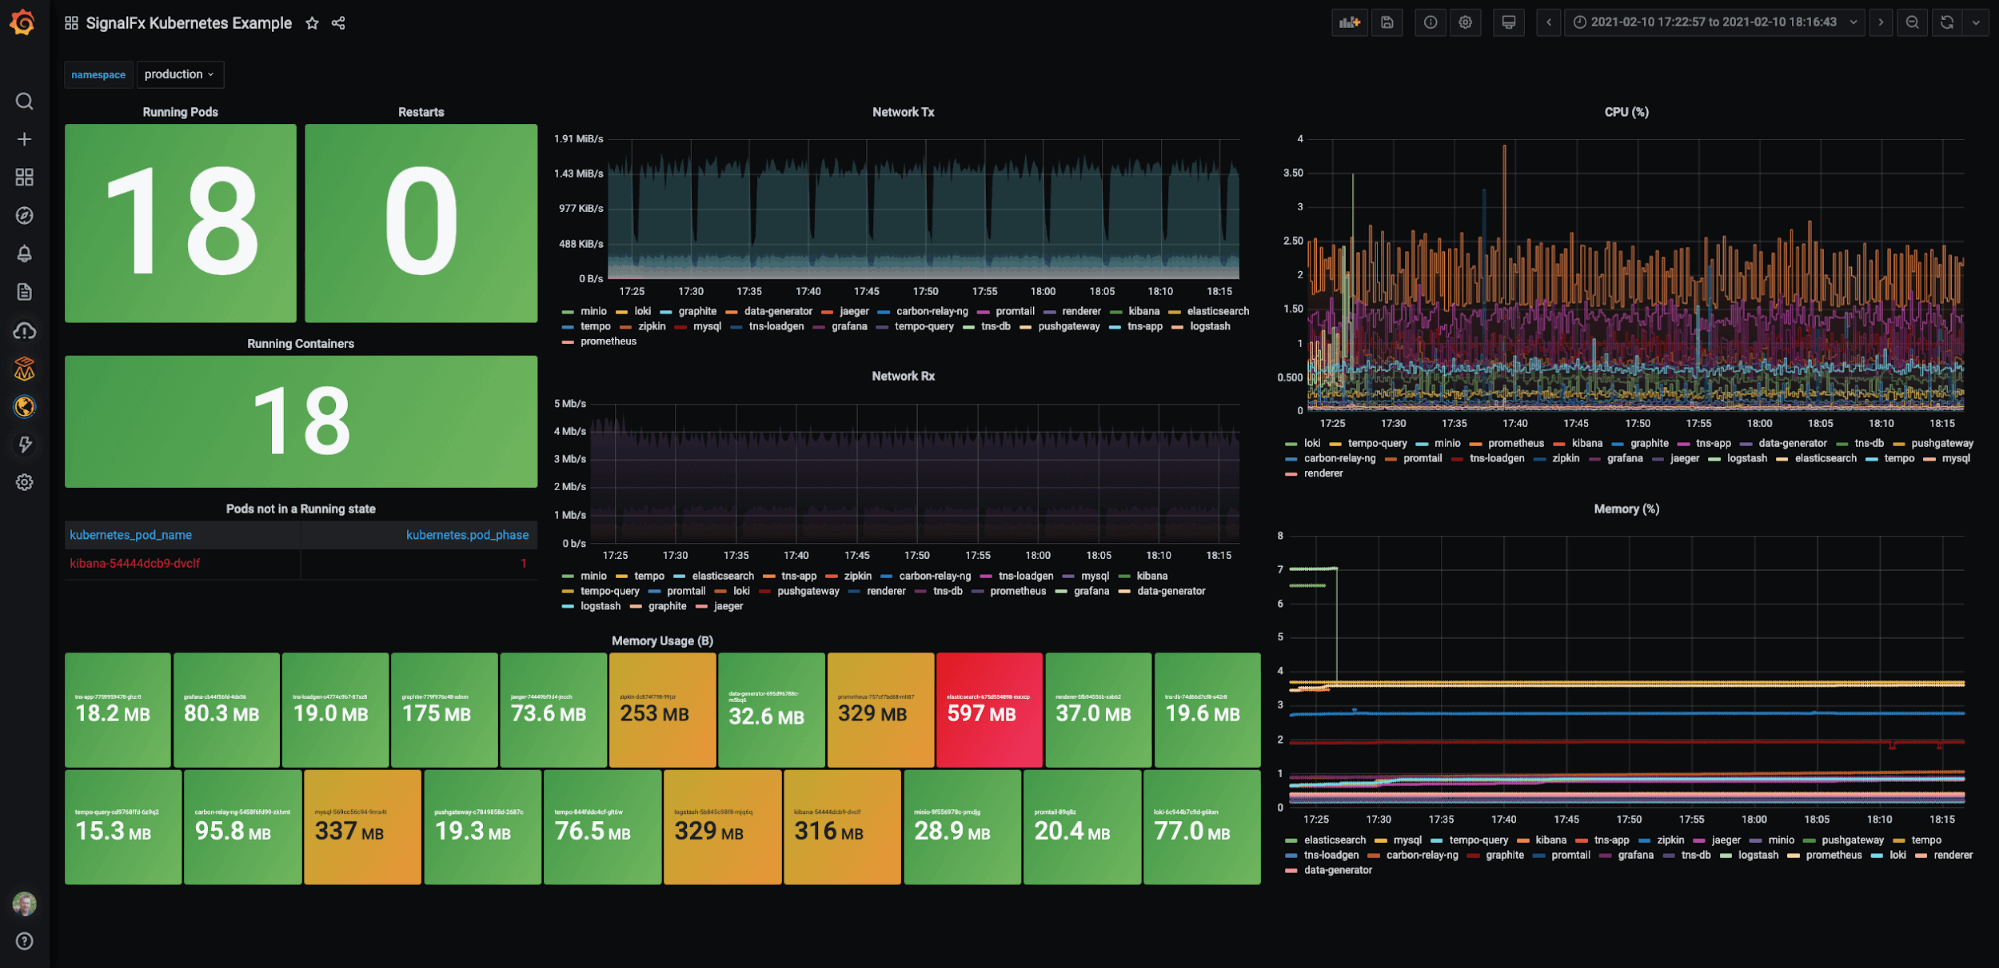
Next, I wanted to add a variable so that I could filter on a particular namespace. I found the variable definition setup could not have been easier: All you have to do is click on the Dimensions button, and the plugin returns the available data dimensions, including kubernetes_name. The final dashboard looked like this:

Going forward, I plan to create a “mixed estate” dashboard showing Prometheus and SignalFx metrics from Kubernetes clusters side-by-side — or even in the same graph, as I discussed in the Wavefront plugin blog. But I thought it’d be repetitive. (i.e., You can check out the Wavefront blog if you are interested, as the technique would be identical. Just swap out the data source Wavefront for Splunk Infrastructure Monitoring, and you are good to go.)
Well, that’s all for today, but please tweet at us to let us know the next plugin you’d like us to write about or support. Until next time!
The Splunk Infrastructure Monitoring Enterprise plugin is available for users with a Grafana Cloud account or with a Grafana Enterprise license. For more information or to get started, check out the Splunk Infrastructure Monitoring solutions page or contact our team.
If you’re not already using Grafana Cloud — the easiest way to get started with observability — sign up now for a free 14-day trial of Grafana Cloud Pro, with unlimited metrics, logs, traces, and users, long-term retention, and access to one Enterprise plugin.


