
Farewell, worldPing. Hello, Grafana Cloud synthetic monitoring!
Many of us get sentimental about past projects we’ve worked on…for me it is a mobile dashboard that leveraged ML/AI to help a sales team make quicker decisions while in the field (nerdy, I know…but it was one of my first projects as a UX Designer when I was starting out my career, and I have many fond memories about this project).
For many members of the team at Grafana Labs, that sentimental project is worldPing. Fun fact: worldPing is the first product that we ever put out to the world!
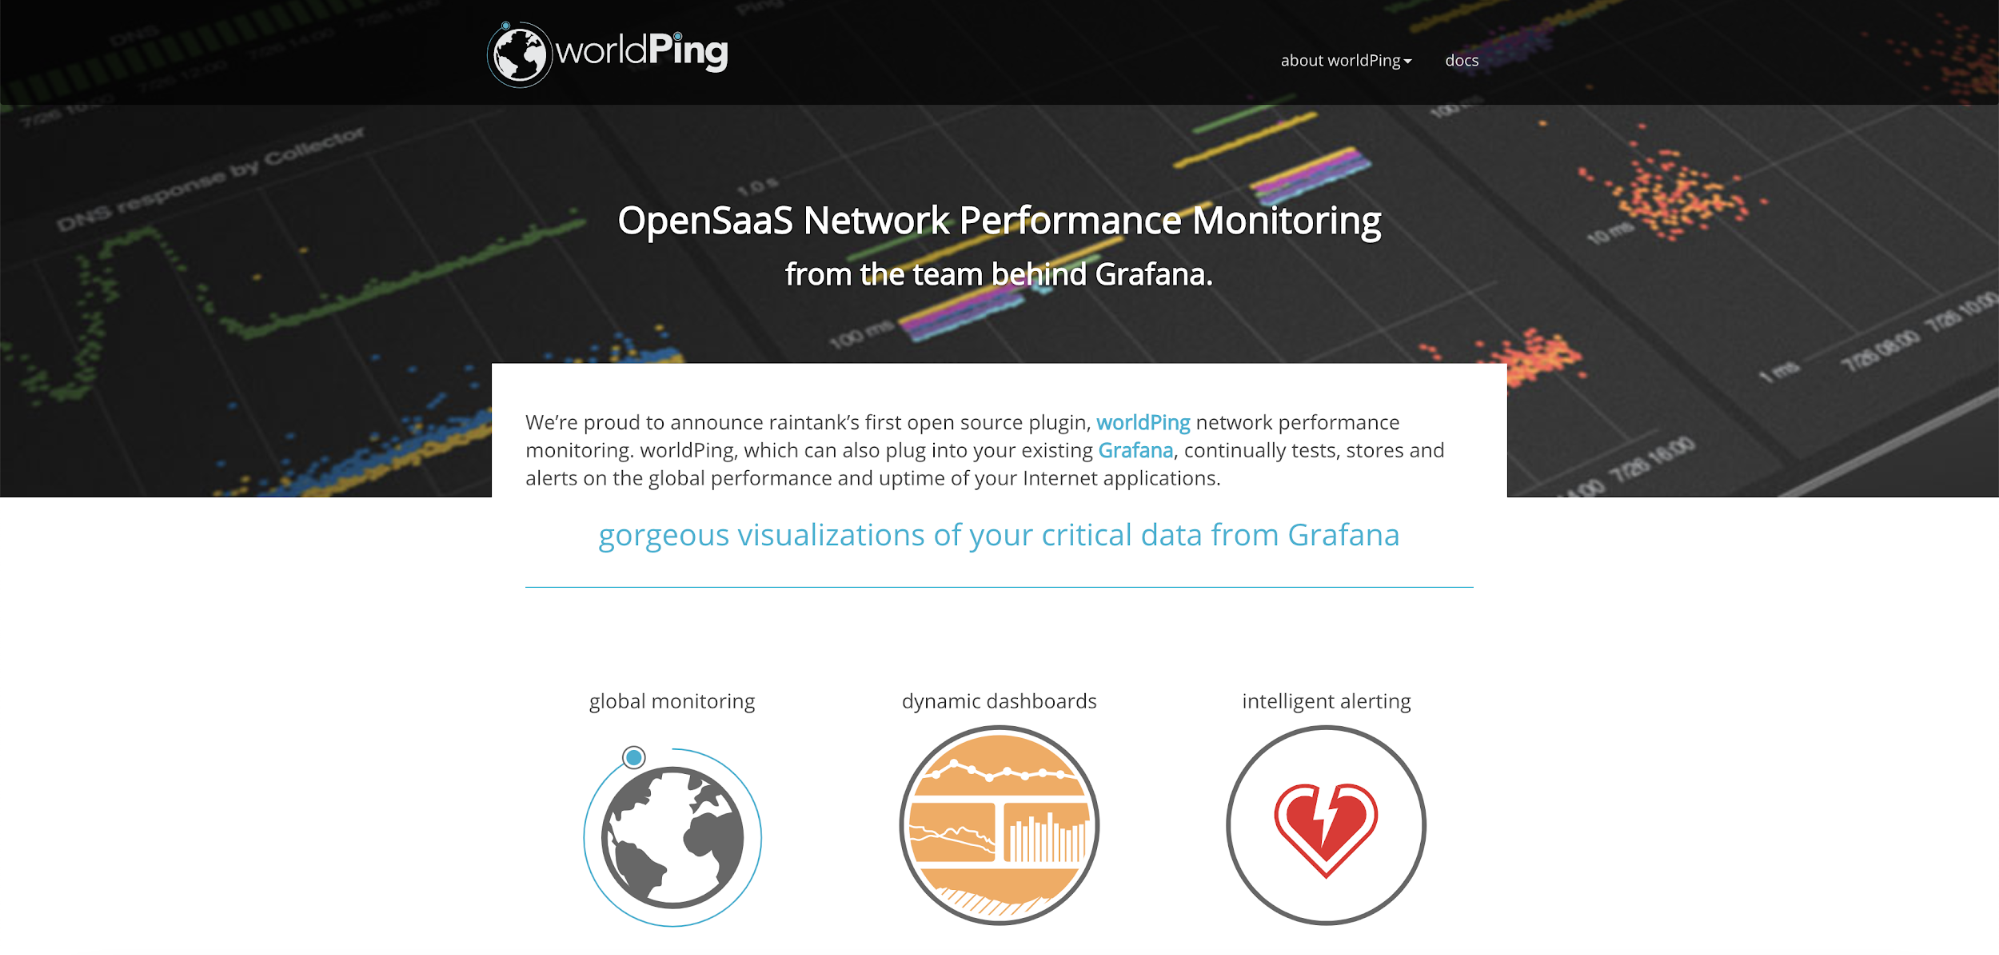
However, Grafana Labs has changed quite a bit as a company over the past few years. We have evolved beyond our original product offerings, hosted Grafana and worldPing. Our product ecosystem now includes Prometheus and Graphite (metrics), Loki (logs), Tempo (traces), and of course, brighter and better iterations of Grafana.
We have evolved our business model, too. For instance, Grafana Cloud now includes a free tier that includes up to 10,000 active series for metrics and 50GB of logs per month. Now, without barriers to cost, everyone can quickly get started monitoring and alerting on their services and troubleshooting by switching between metrics, logs, and traces.
One of the recently added observability features in Grafana Cloud is synthetic monitoring, which is an application built on the Prometheus blackbox exporter. As such, synthetic monitoring is the new, more robust successor to worldPing.
Synthetic monitoring: the new and improved worldPing
Much of the functionality of worldPing is shared by the synthetic monitoring feature: You can continually test, store, and alert on the global performance and availability of your Internet applications, so you can pinpoint issues, fix them immediately, and improve your users’ experience.
Synthetic monitoring focuses on reducing complexity while taking advantage of Grafana Cloud capabilities. The majority of capabilities from worldPing are available in synthetic monitoring. In addition, Grafana Cloud synthetic monitoring includes these key enhancements:
Collection and storage of Prometheus metrics in Grafana Cloud
Loki logs for every check, also stored in your Grafana Cloud, which is useful for troubleshooting alongside metrics
The ability to combine synthetic monitoring data with your other metric and log data, in queries and custom dashboards
Expanded blackbox monitoring capabilities and additional key metrics, such as SSL certificate expiration times, TCP- and HTTP-based checks, as well as Ping and DNS checks
Prometheus-style alerting that delivers alerts to the right people through the right notification method
Sunsetting the worldPing application
With the release of Grafana Cloud synthetic monitoring, we will also be deprecating the worldPing service. Let’s all take a moment of silence to remember the late, great worldPing, and the beginning of Grafana Labs’ journey as a company.
Okay, moment of silence over. We are so excited for you to try synthetic monitoring — and Grafana Cloud if you have not signed up already!
I am a worldPing user. What does this mean for me?
We plan to sunset the worldPing service on April 1, 2021. On this date, we will disable all public probes in worldPing, which will disable your checks and alerts. No new data will be generated from your checks, and any alerts you’ve created in worldPing will no longer be fired.
To ensure a smooth transition from worldPing to synthetic monitoring, we encourage you to begin using synthetic monitoring in your Grafana Cloud account right away. Synthetic monitoring is available by default with Grafana Cloud.

Once you land in synthetic monitoring, simply click the “get started” button to start creating checks! Read this blog post about getting up and running with synthetic monitoring and our synthetic monitoring documentation.
If you are not currently using Grafana Cloud, you can sign up for a free 14-day trial of the Pro plan to explore unlimited metrics, logs, and users, long-term retention, team collaboration features, and more. Afterward, you’ll automatically be moved to the new free tier, which gives you access to our composable observability platform for free with up to 10,000 active series, 50GB of logs, and 14-day retention for metrics and logs. Learn more about the free and Pro plans on our website.
Differences between worldPing and synthetic monitoring
While both applications were created to provide you with a tool to monitor your services and systems from an external point of view, there are several key differences to note in the functionality and experience between worldPing and synthetic monitoring (beyond what I described above as the benefits that come because synthetic monitoring is built on Prometheus). Our synthetic monitoring documentation provides more detail about these differences, but I will list them briefly here.
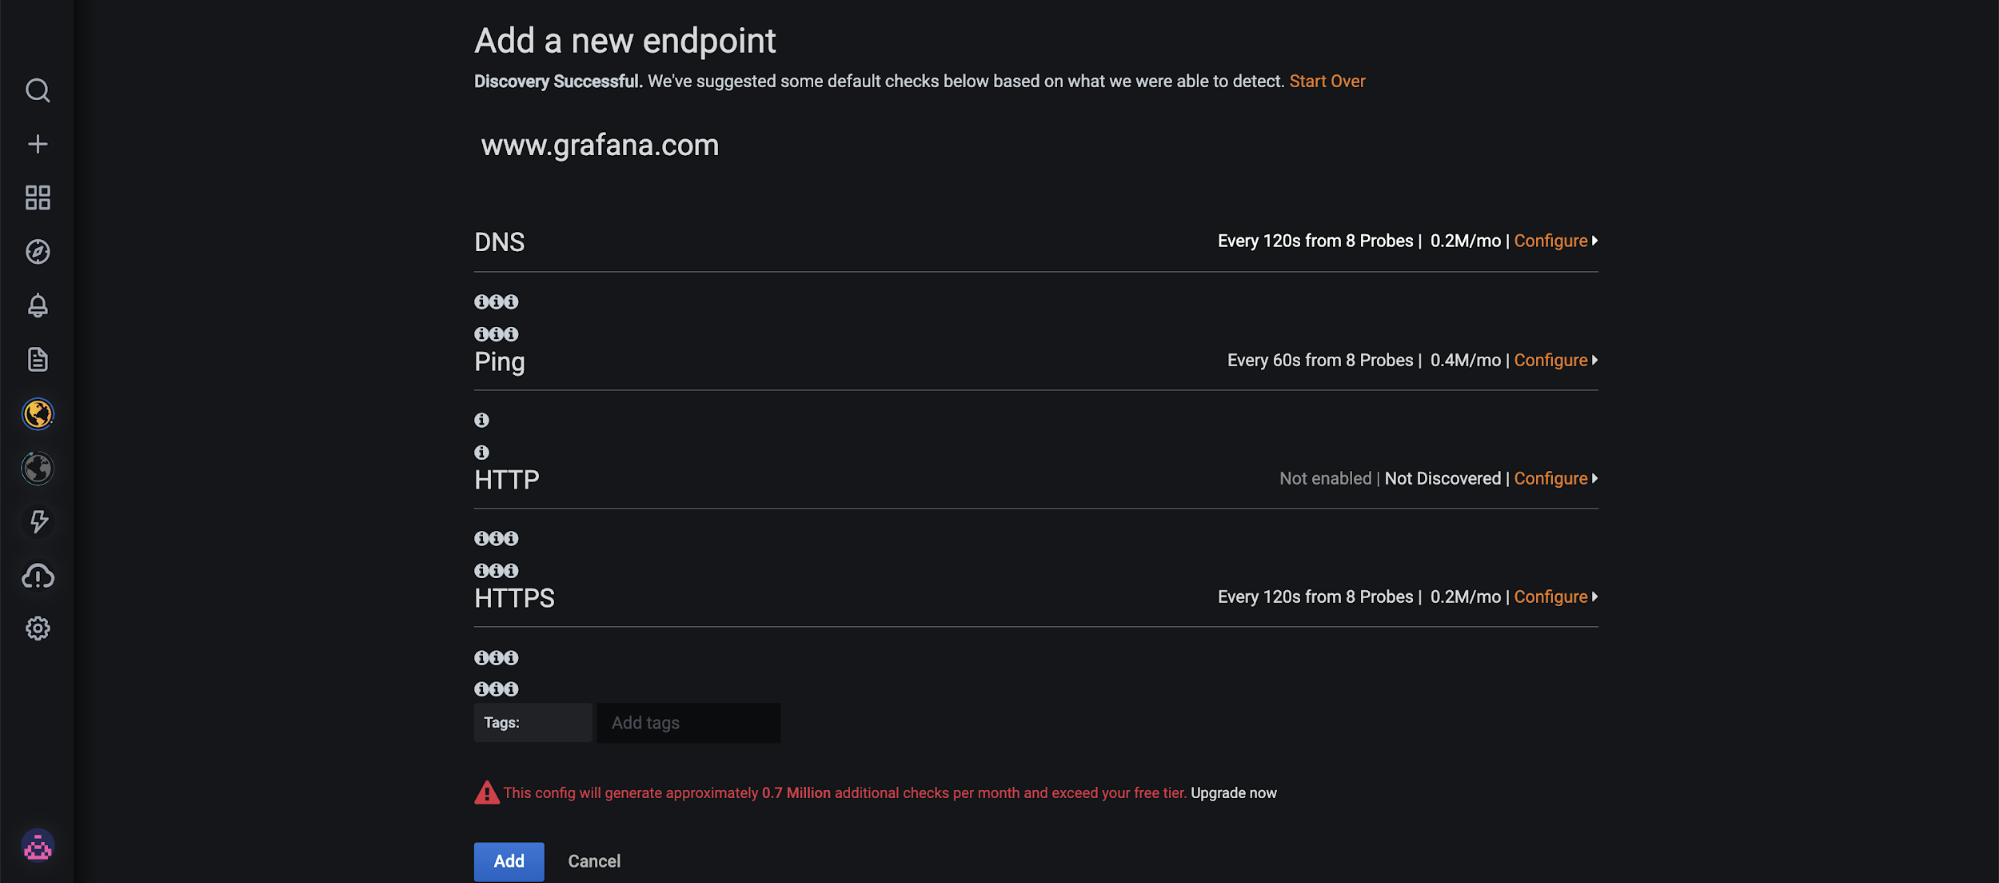
First, if you want to create a few different types of checks (HTTP, DNS, TCP, Ping) for a single endpoint, the experience is a bit different. In worldPing, you enter an endpoint and then the system returns a form where you can create different types of checks for that endpoint.

The form becomes unmanageable with so many different options to configure all on one page (shown below).
In synthetic monitoring, if you want to create multiple check types for a single endpoint, you must create each check separately (shown below). If you have many endpoints and many checks to set up, there is a way to do it via jsonnet or terraform. Look out for a future blog post on how to do this, written by members of Grafana’s SRE team!
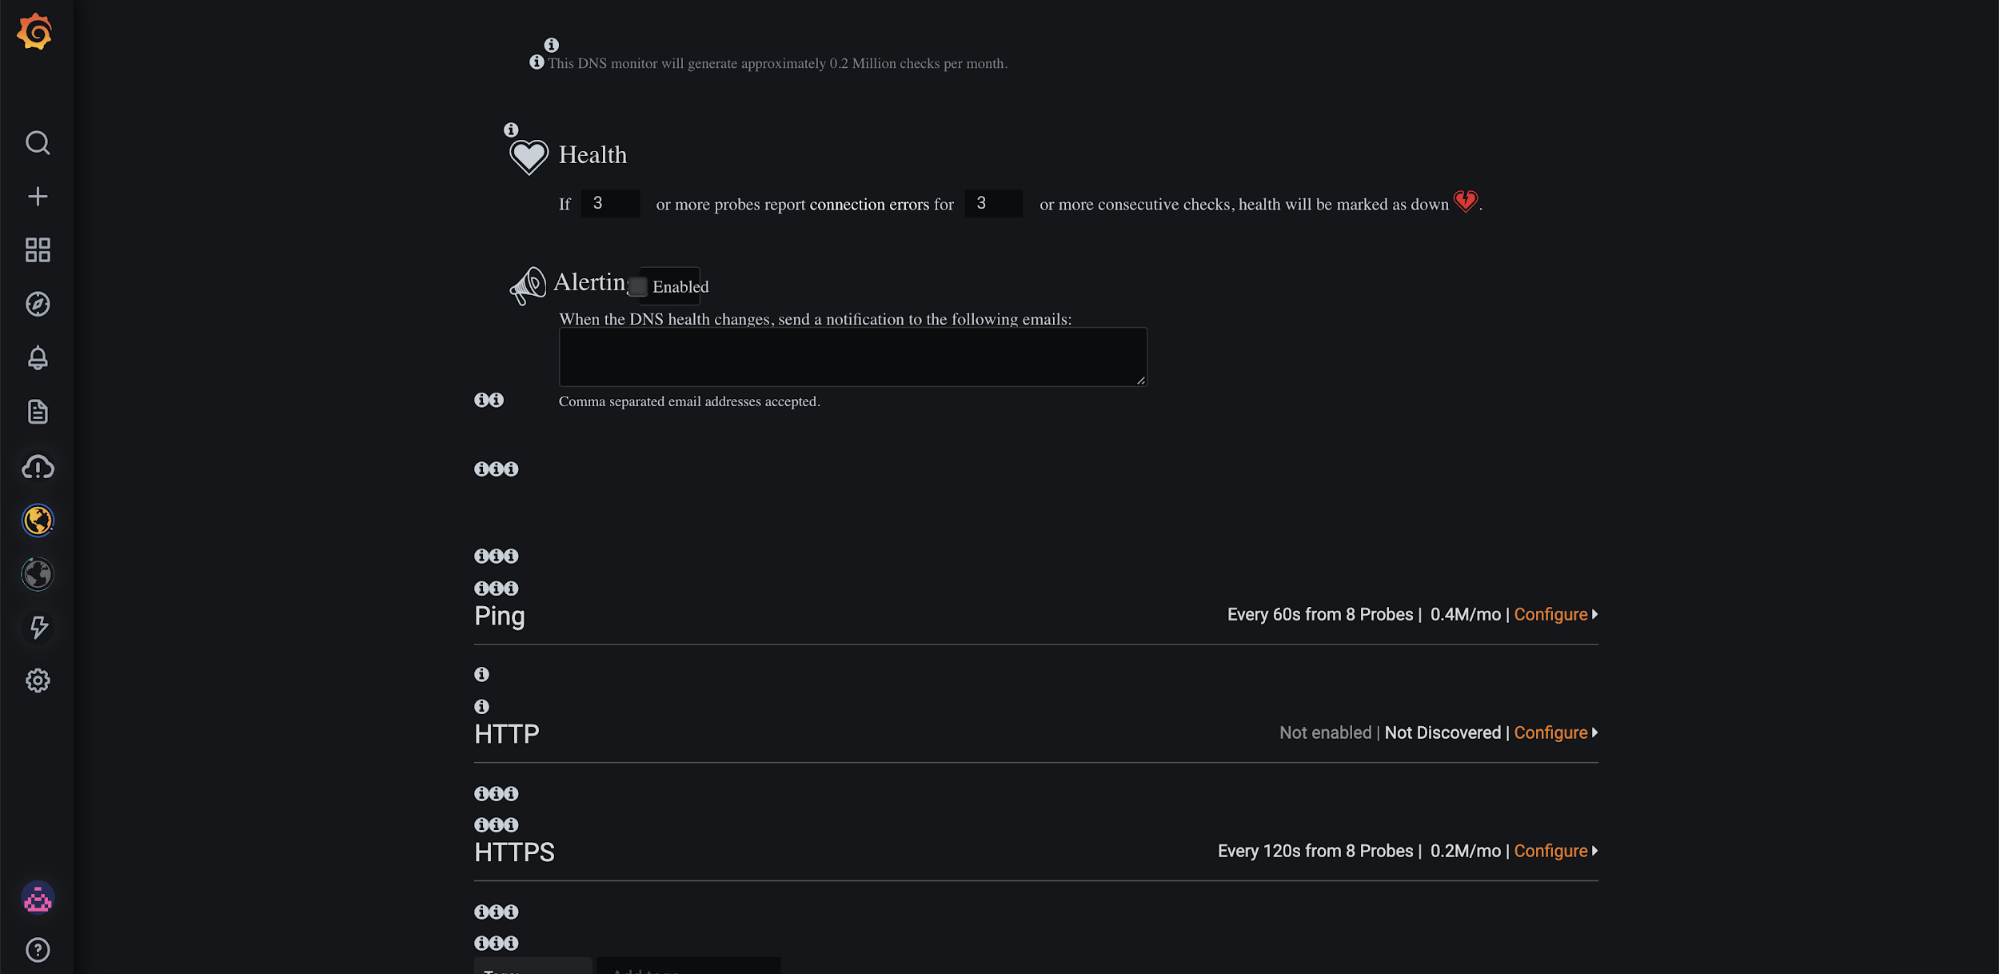
Another key difference is how alerts are set up. worldPing alerts are built on Grafana dashboard alerts, and are configured when you create a check. If you want to create an alert for every check, you must enter alert conditions every time you create a check (shown below, under the Health section). You are also limited by the alert rules available in the UI (e.g. “If X or more probes report connection errors for X or more consecutive checks, health will be marked as down”), and you have only one option for receiving the alerts: email.
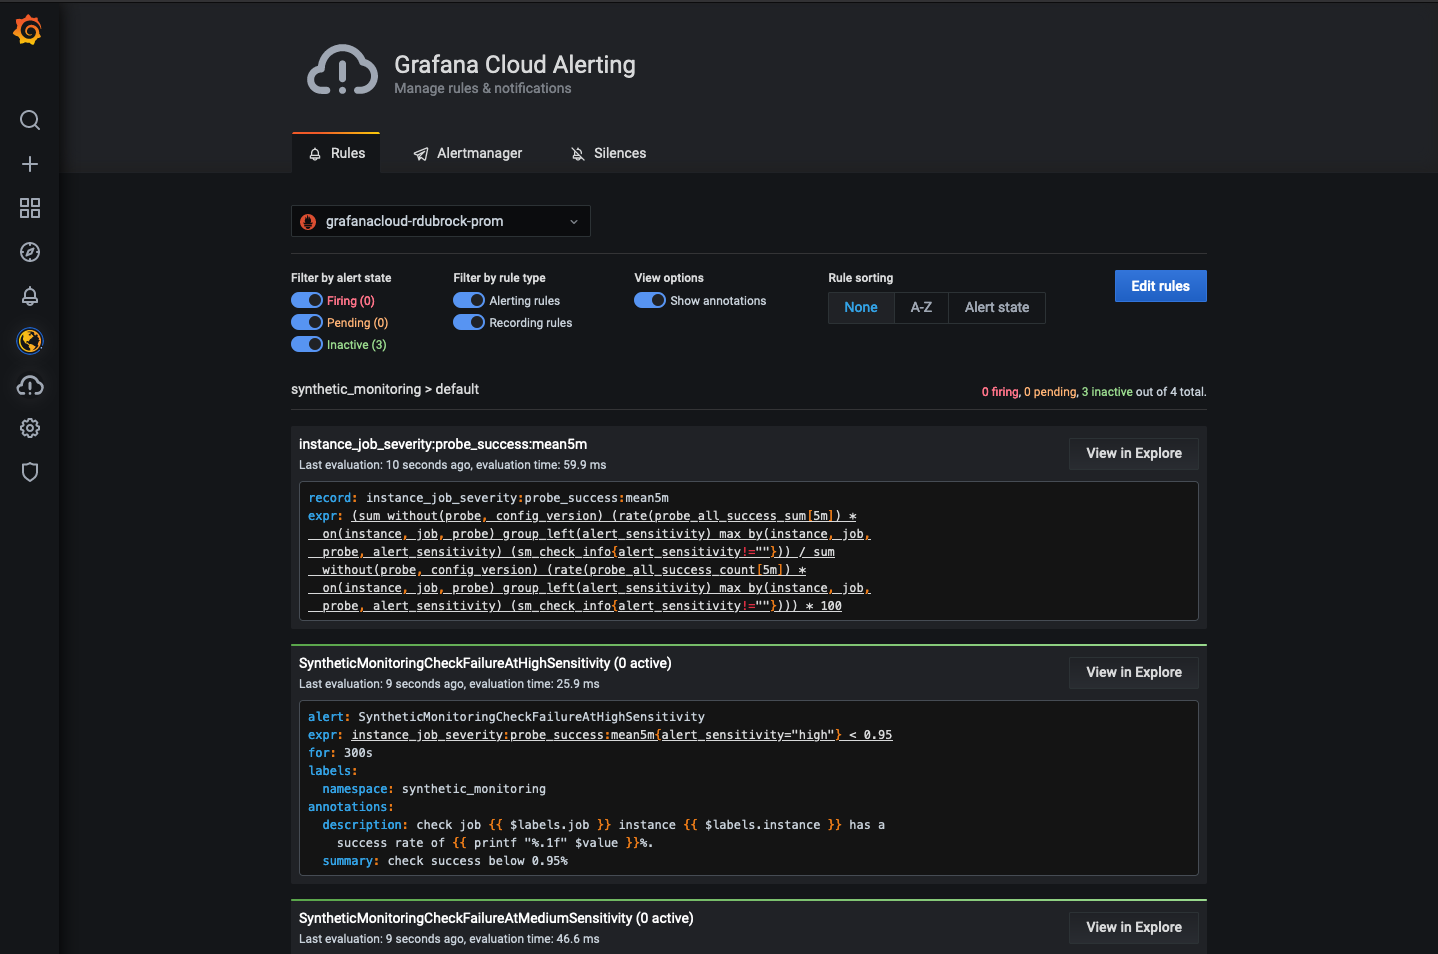
In synthetic monitoring, alerts are built on Prometheus alerting, also called Grafana Cloud alerting. We provide three default alert sensitivities that you can add to checks. The default alert sensitivities are as follows:
- HighSensitivity: If 5% of probes fail for 5 minutes, then fire an alert [via the routing that you have set up]
- MedSensitivity: If 10% of probes fail for 5 minutes, then fire an alert [via the routing that you have set up]
- LowSensitivity: If 25% of probes fail for 5 minutes, then fire an alert [via the routing that you have set up]
You can view and edit these default alerts in the alerts tab in synthetic monitoring (shown below).

In order for these alerts to fire, you must complete 2 steps:
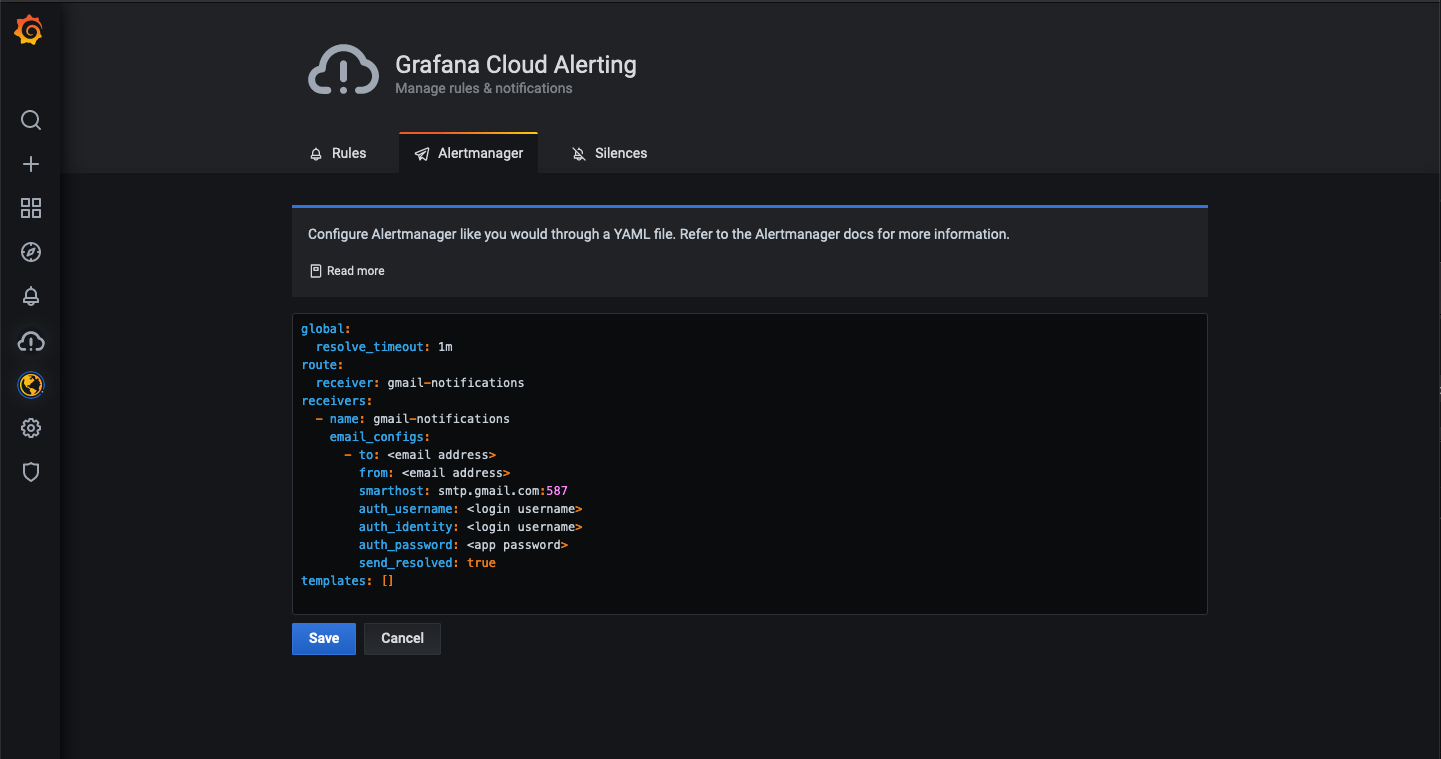
- Set up routing for the alerts. You may do this in Grafana Cloud alerting, under the Alertmanager tab. See our documentation on how to do this.
- When you are creating a check that you want to alert on, you must select one of the default alert sensitivities from a drop down in the Alerting section of the check form (shown below).

If these alerts are not sufficient for your needs, you are welcome to write your own alerts in PromQL in Grafana Cloud alerting (shown below).
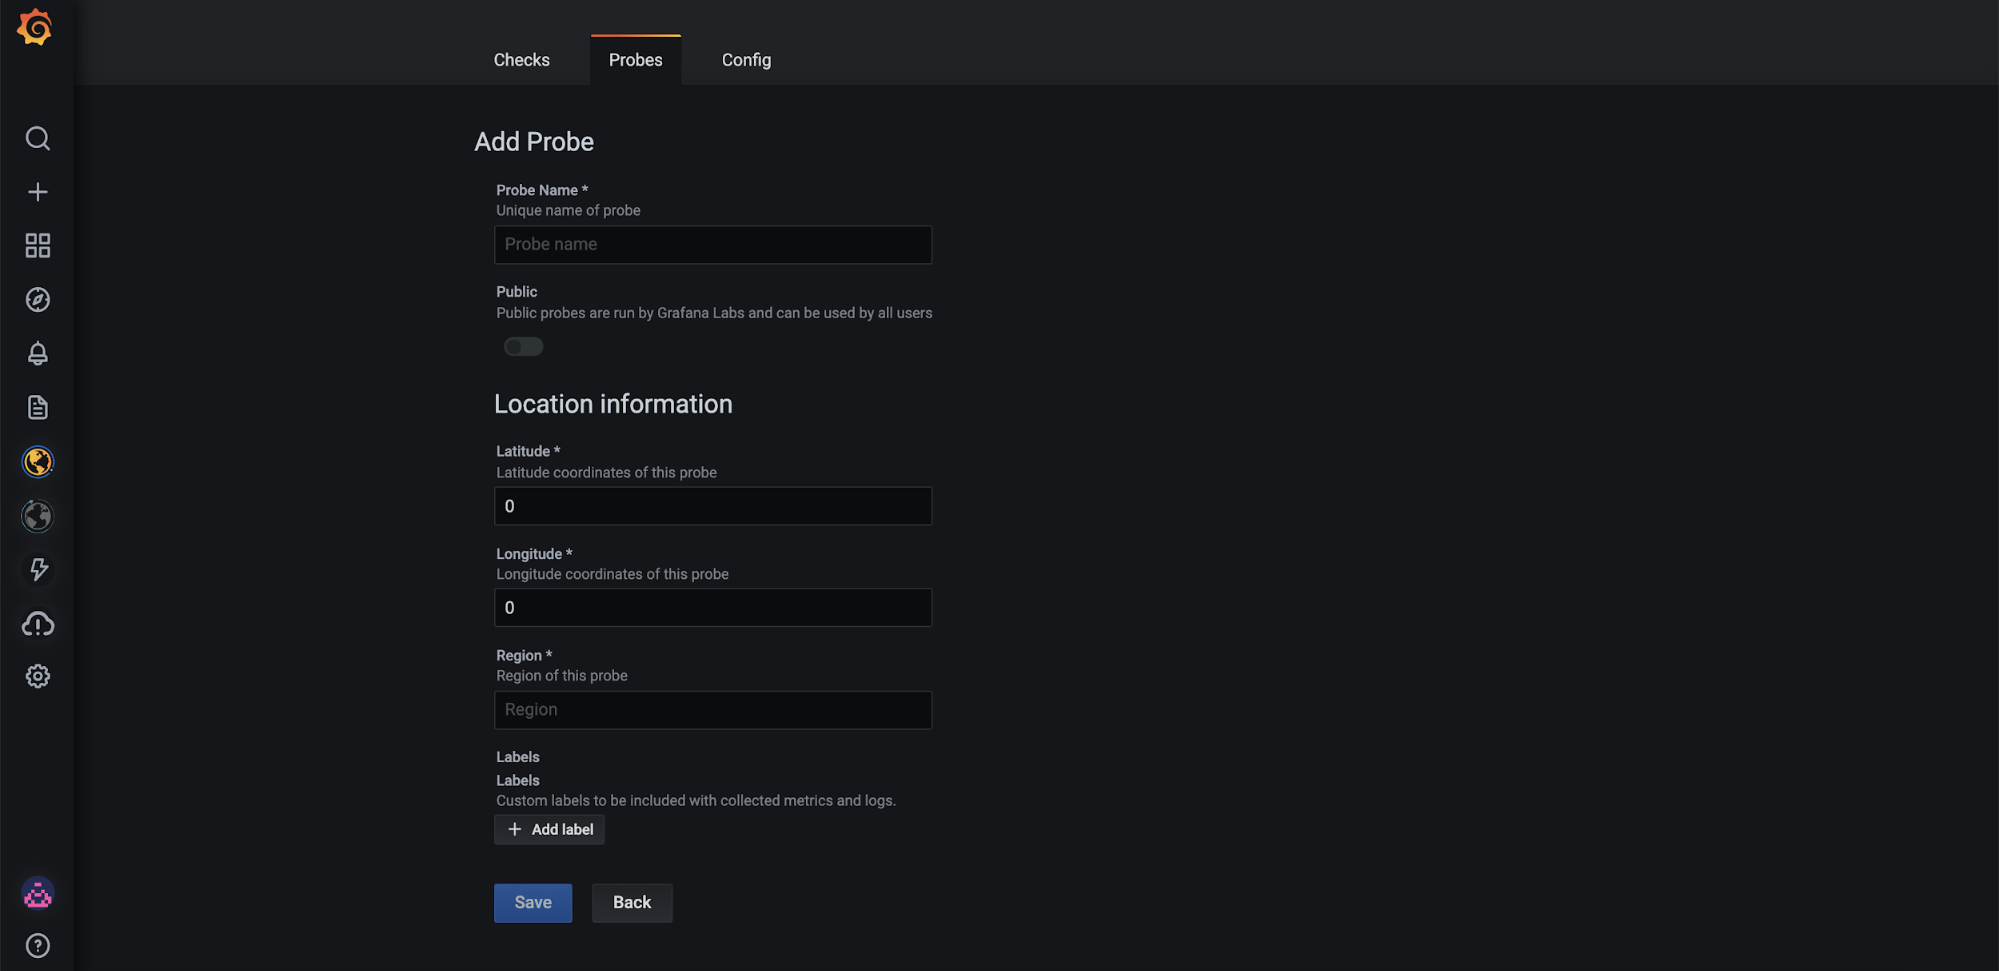
One more small difference is the amount and location of public probes available to choose for your checks. worldPing offers 23 public probes to choose from, and synthetic monitoring offers 21 public probes. Many of the locations are similar, but there are some probes that exist in the same country or region but a different city. As in worldPing, you can set up your own private probes (the form to create a private probe in synthetic monitoring is shown below).
The final difference between worldPing and synthetic monitoring is how the applications are priced. worldPing was a standalone application with its own pricing structure. Essentially, worldPing was a simple translation of checks to dollars: A certain amount of checks cost a certain amount of money.
Because synthetic monitoring is a feature of Grafana Cloud, the metrics and logs published from synthetic monitoring cost the same as other metrics and logs published to your Grafana Cloud. Metrics and logs are translated into active series, which translates into dollars. Learn more about active series here. The main thing to know is that whereas all checks cost the same in worldPing, the cost of different check types vary in synthetic monitoring. Different check types publish different metrics, and an HTTP check might publish more metrics → generate more active series → and therefore cost more money per check.
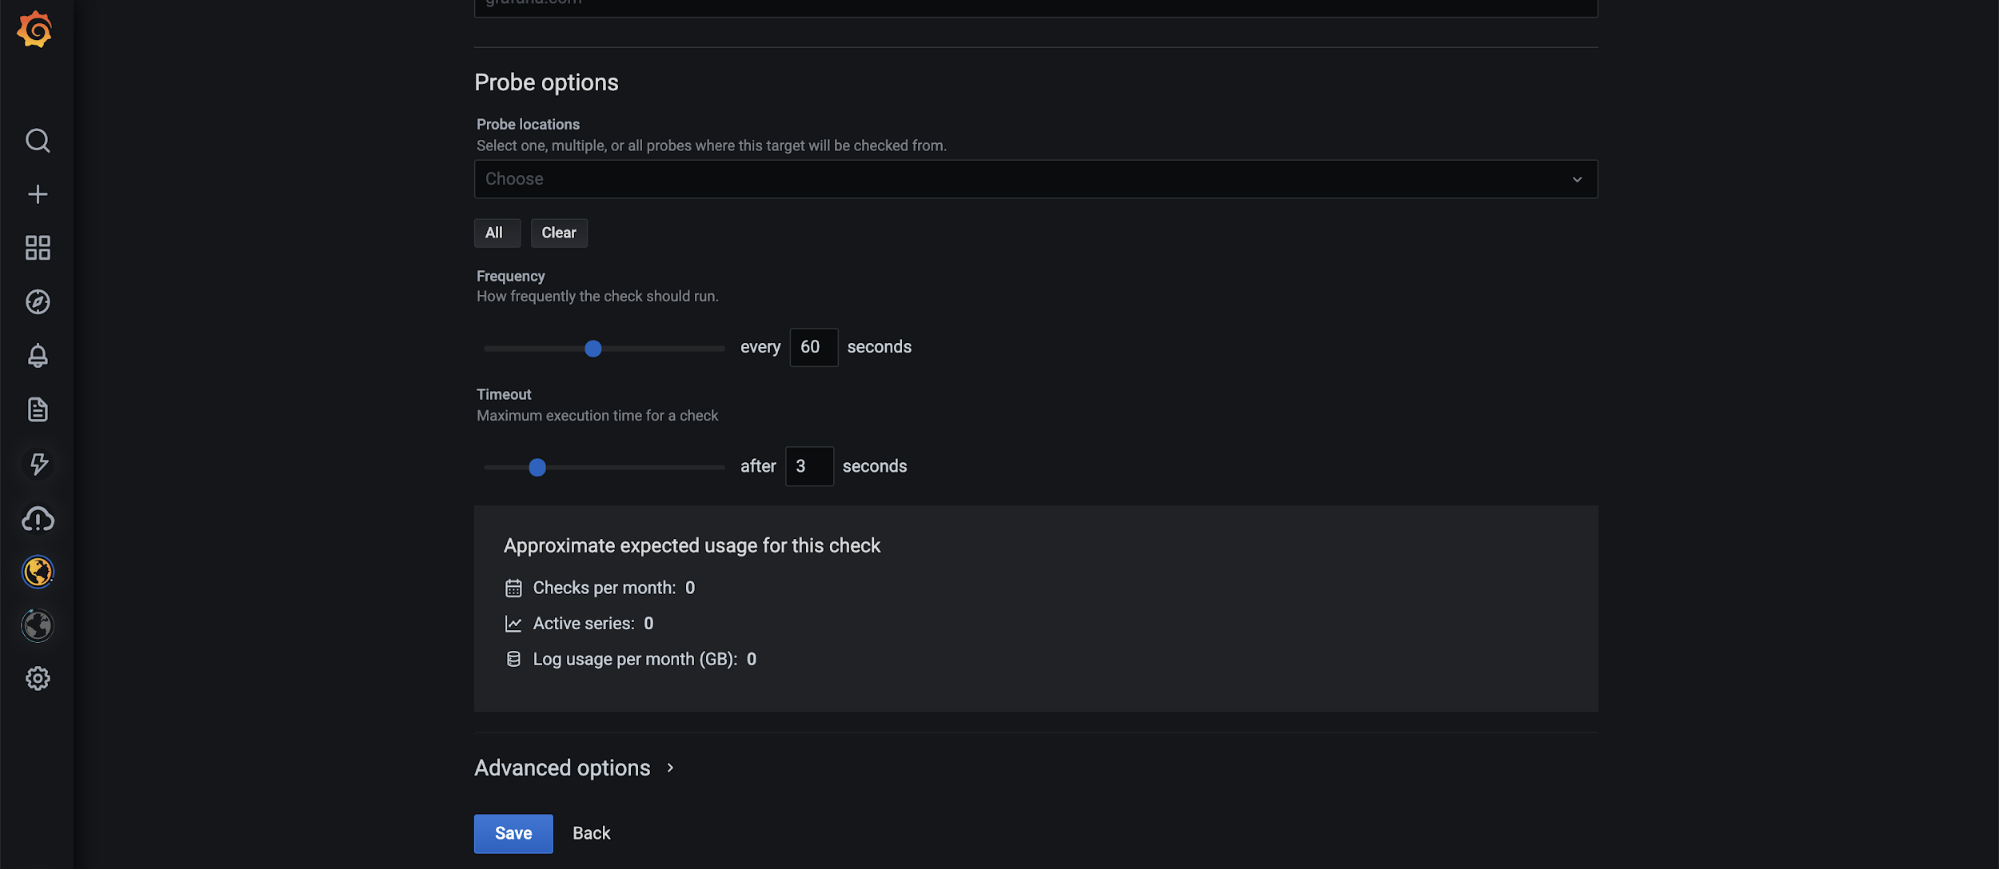
To help you understand the association between check options and active series, we built a nifty calculator in the synthetic monitoring UI to show you how many checks, metrics, logs, and active series will be run for the check you are creating (shown below).
I recognize that this pricing explanation may sound scary, but do not fret! Firstly, our customers who have already switched from worldPing to synthetic monitoring are actually paying less with synthetic monitoring. Also, up to 10,000 active series are included in Grafana Cloud’s free plan, which includes synthetic monitoring. So if you were using worldPing for free, there is also a way to use synthetic monitoring for free.
Farewell, worldPing!
On April 1, it will be time to say farewell to our friend worldPing. We will lay her to rest, remember her dearly, and eventually move on. Luckily, there is a wonderful replacement available to all of us. Learn how to get up and running with synthetic monitoring in this blog post. If you haven’t already, check out synthetic monitoring in your existing Grafana Cloud instance, or sign up for Grafana Cloud today!


