How to get started quickly with the new synthetic monitoring feature in Grafana Cloud
We recently launched synthetic monitoring, which helps you understand your users’ experience and improve website performance by proactively monitoring your services. This feature, which surfaces the powerful capabilities of Prometheus blackbox exporter, is the next iteration of worldPing.
The new synthetic monitoring feature is available to all Grafana Cloud users — including those on the recently announced free plan, which allows up to 10,000 series for Prometheus or Graphite metrics and 50GB of logs. With Grafana Cloud, you can look at what’s happening inside your services and systems through hosted metrics, logs, and traces — and switch between all three.
To get an external point of view of your services and systems, you can set up checks using synthetic monitoring.
“worldPing 2.0”
Whereas worldPing was a great tool for an “at-a-glance” view of your infrastructure availability, the new synthetic monitoring feature takes the concepts behind this and improves on them by an order of magnitude.
The most noticeable improvements are in the interface for synthetic monitoring. worldPing attempts to discover a set of protocols to probe (ICMP, DNS, HTTP[S] endpoints) and then allows the configuration of these on the same page. However, this can lead to a lot of clutter, and it makes creation and updating checks cumbersome. Secondly, the worldPing home page offers a list of the endpoints being checked, as well as links to separate dashboards for the different protocol checks, but there is no easy way to get an “at-a-glance” overview of all the tested endpoints.
Synthetic monitoring clearly separates out the configuration of protocol checks (with many detailed additions on how checks are carried out), as well as utilizing a home page that immediately shows you the health of all of your checks, grouped by protocol.
The most notable change with synthetic monitoring is that it uses the hosted metrics and logs that you already have with Grafana Cloud to store data for the checks being carried out.
The power of Prometheus
Beyond storage of logs and metrics via Loki and Prometheus, there are many other benefits to our synthetic monitoring feature that come from being built on Prometheus blackbox exporter.
First, Prometheus blackbox exporter, and by extension synthetic monitoring, offers the ability to create Ping, HTTP/HTTPS, TCP, and DNS checks, with a multitude of configuration options for each. On top of the checks provided by Prometheus blackbox exporter, synthetic monitoring also supports two additional check types for traceroute and MultiHTTP. Read more about supported check types in the last section of this article.
Alerts for synthetic monitoring are built on Prometheus alerting. Currently, these alerts can be written using the textbox editor in Grafana Cloud alerting, which enables you to write alerts quickly without any additional tooling, downloads, or command line. In addition, we will soon be releasing a new alerts tab in synthetic monitoring, where you will be able to set up alerts for synthetic monitoring checks using inputs right from the synthetic monitoring UI. These alerts will, of course, be created as Prometheus alerts on the backend and therefore will be editable and viewable from Grafana Cloud alerting too.
Finally, because synthetic monitoring publishes Prometheus metrics and Loki logs, you can combine these metrics and logs with other data in custom queries and dashboards. You can reference multiple Prometheus data sources in a single query, or pull different queries into multiple panels within the same dashboard.
Installation and configuration
Let’s dive into getting synthetic monitoring installed into our Grafana instance. There are a couple of different ways to run synthetic monitoring, but all methods require a Grafana Cloud account to store the data and function correctly.
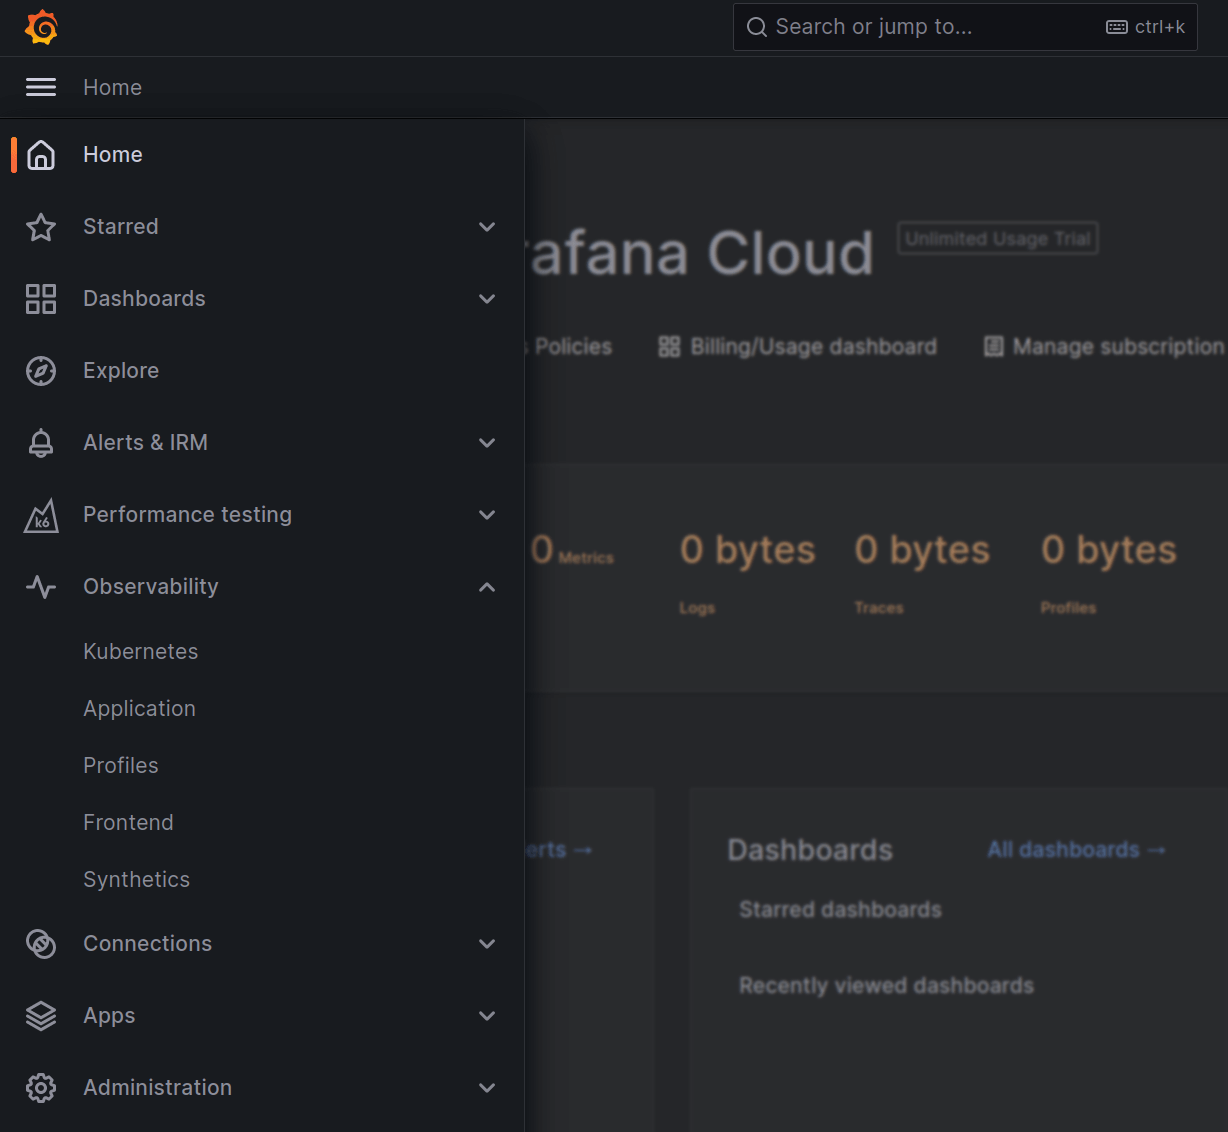
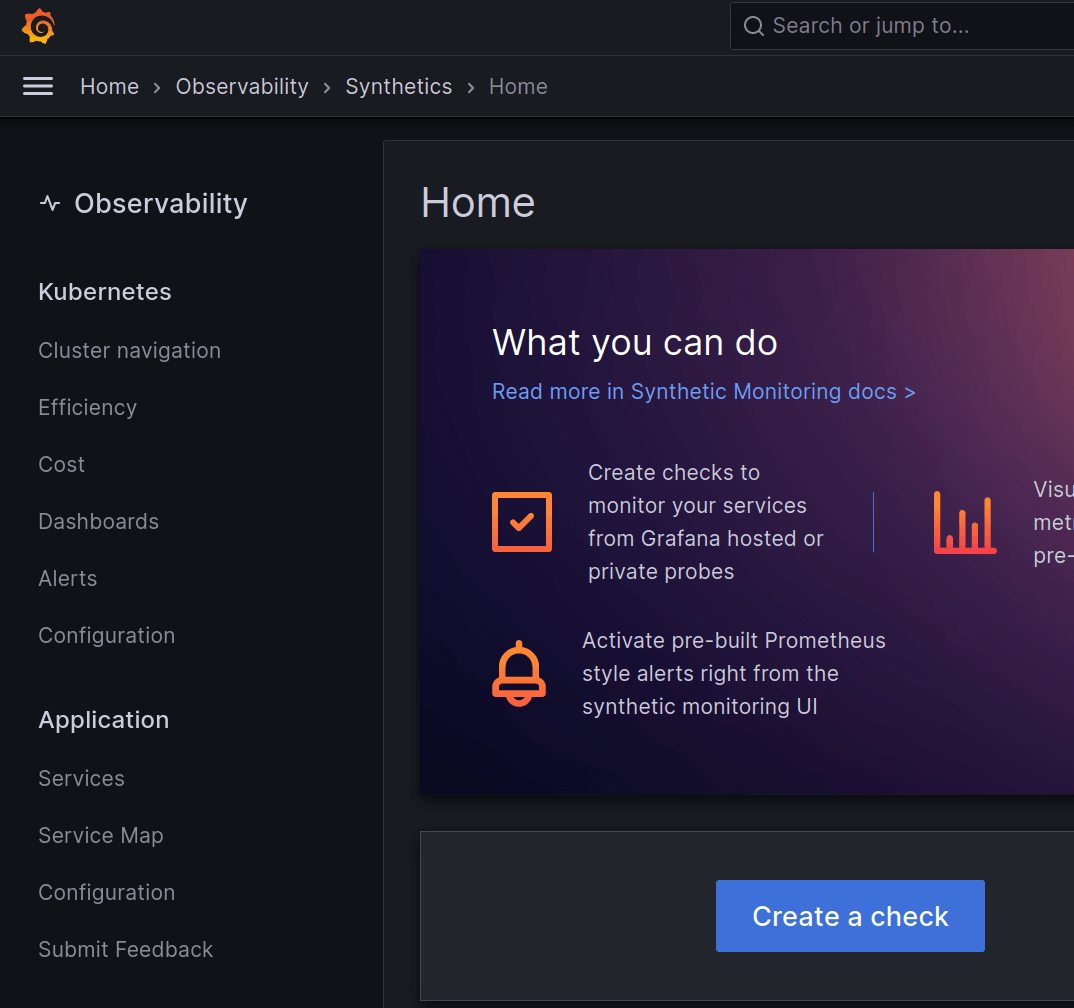
In your Grafana Cloud account, open the left-hand navigation bar by clicking on the top left hamburger button, then click on Synthetics under Observability section. Here you can see the homepage, which shows direct access to different dashboards, and options for creatig new checks, view existing checks, or configure alerts. You can also see a summary of your synthetic monitoring usage in the lower part of the page.

Adding an initial check
Once synthetic monitoring has been installed into your Grafana instance, it’s time to add a check!
From the synthetics homepage, select the option to Create a check.

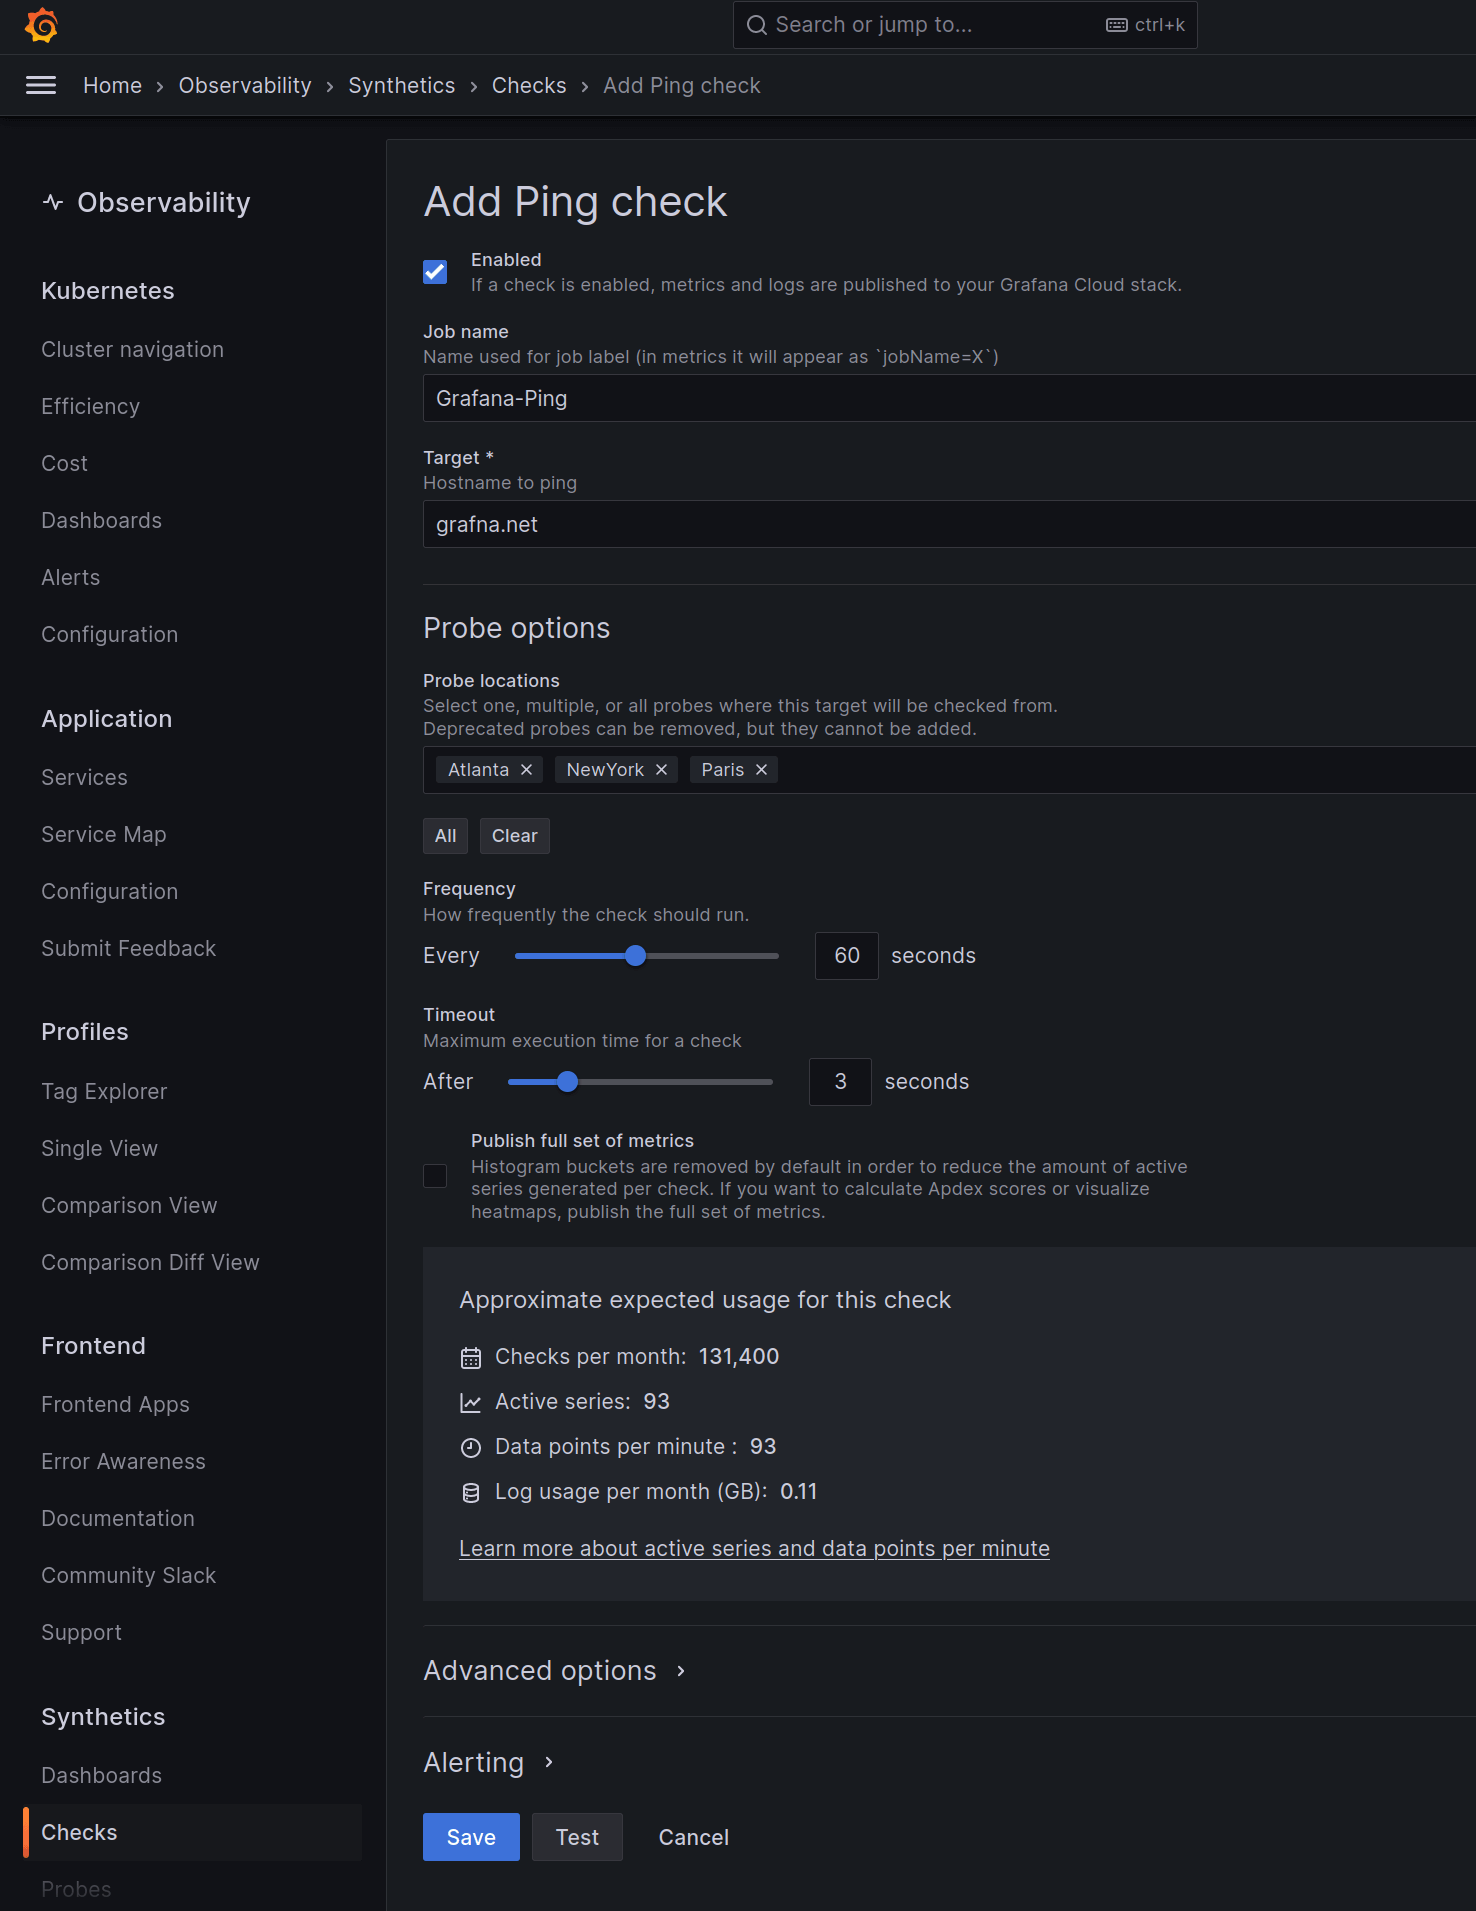
We’re going to add a new ping (also known as an ICMP echo) check, to ensure that our grafana.net server is always available from various locations around the world. Select PING as the check type.
Enter Grafana-Ping into the Job Name field, and then set grafna.net as the Target (this is a deliberate typo, bear with us!).
Now we need to select the location of the probes to use in this check. A probe is one of a number of blackbox agents that are located around the globe, available in a wide range of locations, tasked with carrying out the configured checks on the targets specified. Each probe sends metrics and logs to the synthetic monitoring backend, including such information as target availability and health and response latencies, which are then rendered in the synthetic monitoring dashboard.
For now, select a few different locations for the probes that will send ICMP echo packets (pings) to the grafana.net host. Do this by selecting the Probe Locations menu in the Probe Options section. In the example below, you’ll see we’ve selected Atlanta, New York and Paris. Other locations such as San Francisco, Sao Paulo, Frankfurt, London, Bangalore, Singapore Sydney or Tokyo are also available. See the full list of locations in the public probes docs page.
The Probe Options section allows you to configure how often a check should be carried out, as well as the timeout for it. The timeout will mark a ping check as failed if it does not receive an IGMP echo response within that timeout period.
If you expand the final section, Advanced Options, you’ll note that there are extra configuration options here that allow you to set extra labels on the metrics and logs (which you’ll be able to use in a PromQL or LogQL query as label selectors). You also have the ability to change the Internet Protocol version being used (IPv4, IPv6, or both) and to decide whether or not to set the “Don’t Fragment” bit (only for IPv4).
We’re going to stick with the default options for now and test with IPv4. Your ping check page should now look something like the following:

Finally, select the Save button.
The list of checks
You’ll be taken back to the list of checks, which will show our new check has been registered.
You’ll now see the ping check in the list of checks, showing that the check is active. After a little while, the check will show 0% for uptime and reachability. This shows that the check is failing! We can jump to the dashboard for this specific check by clicking on the View dashboard link, right below the latency metric.

The ping dashboard
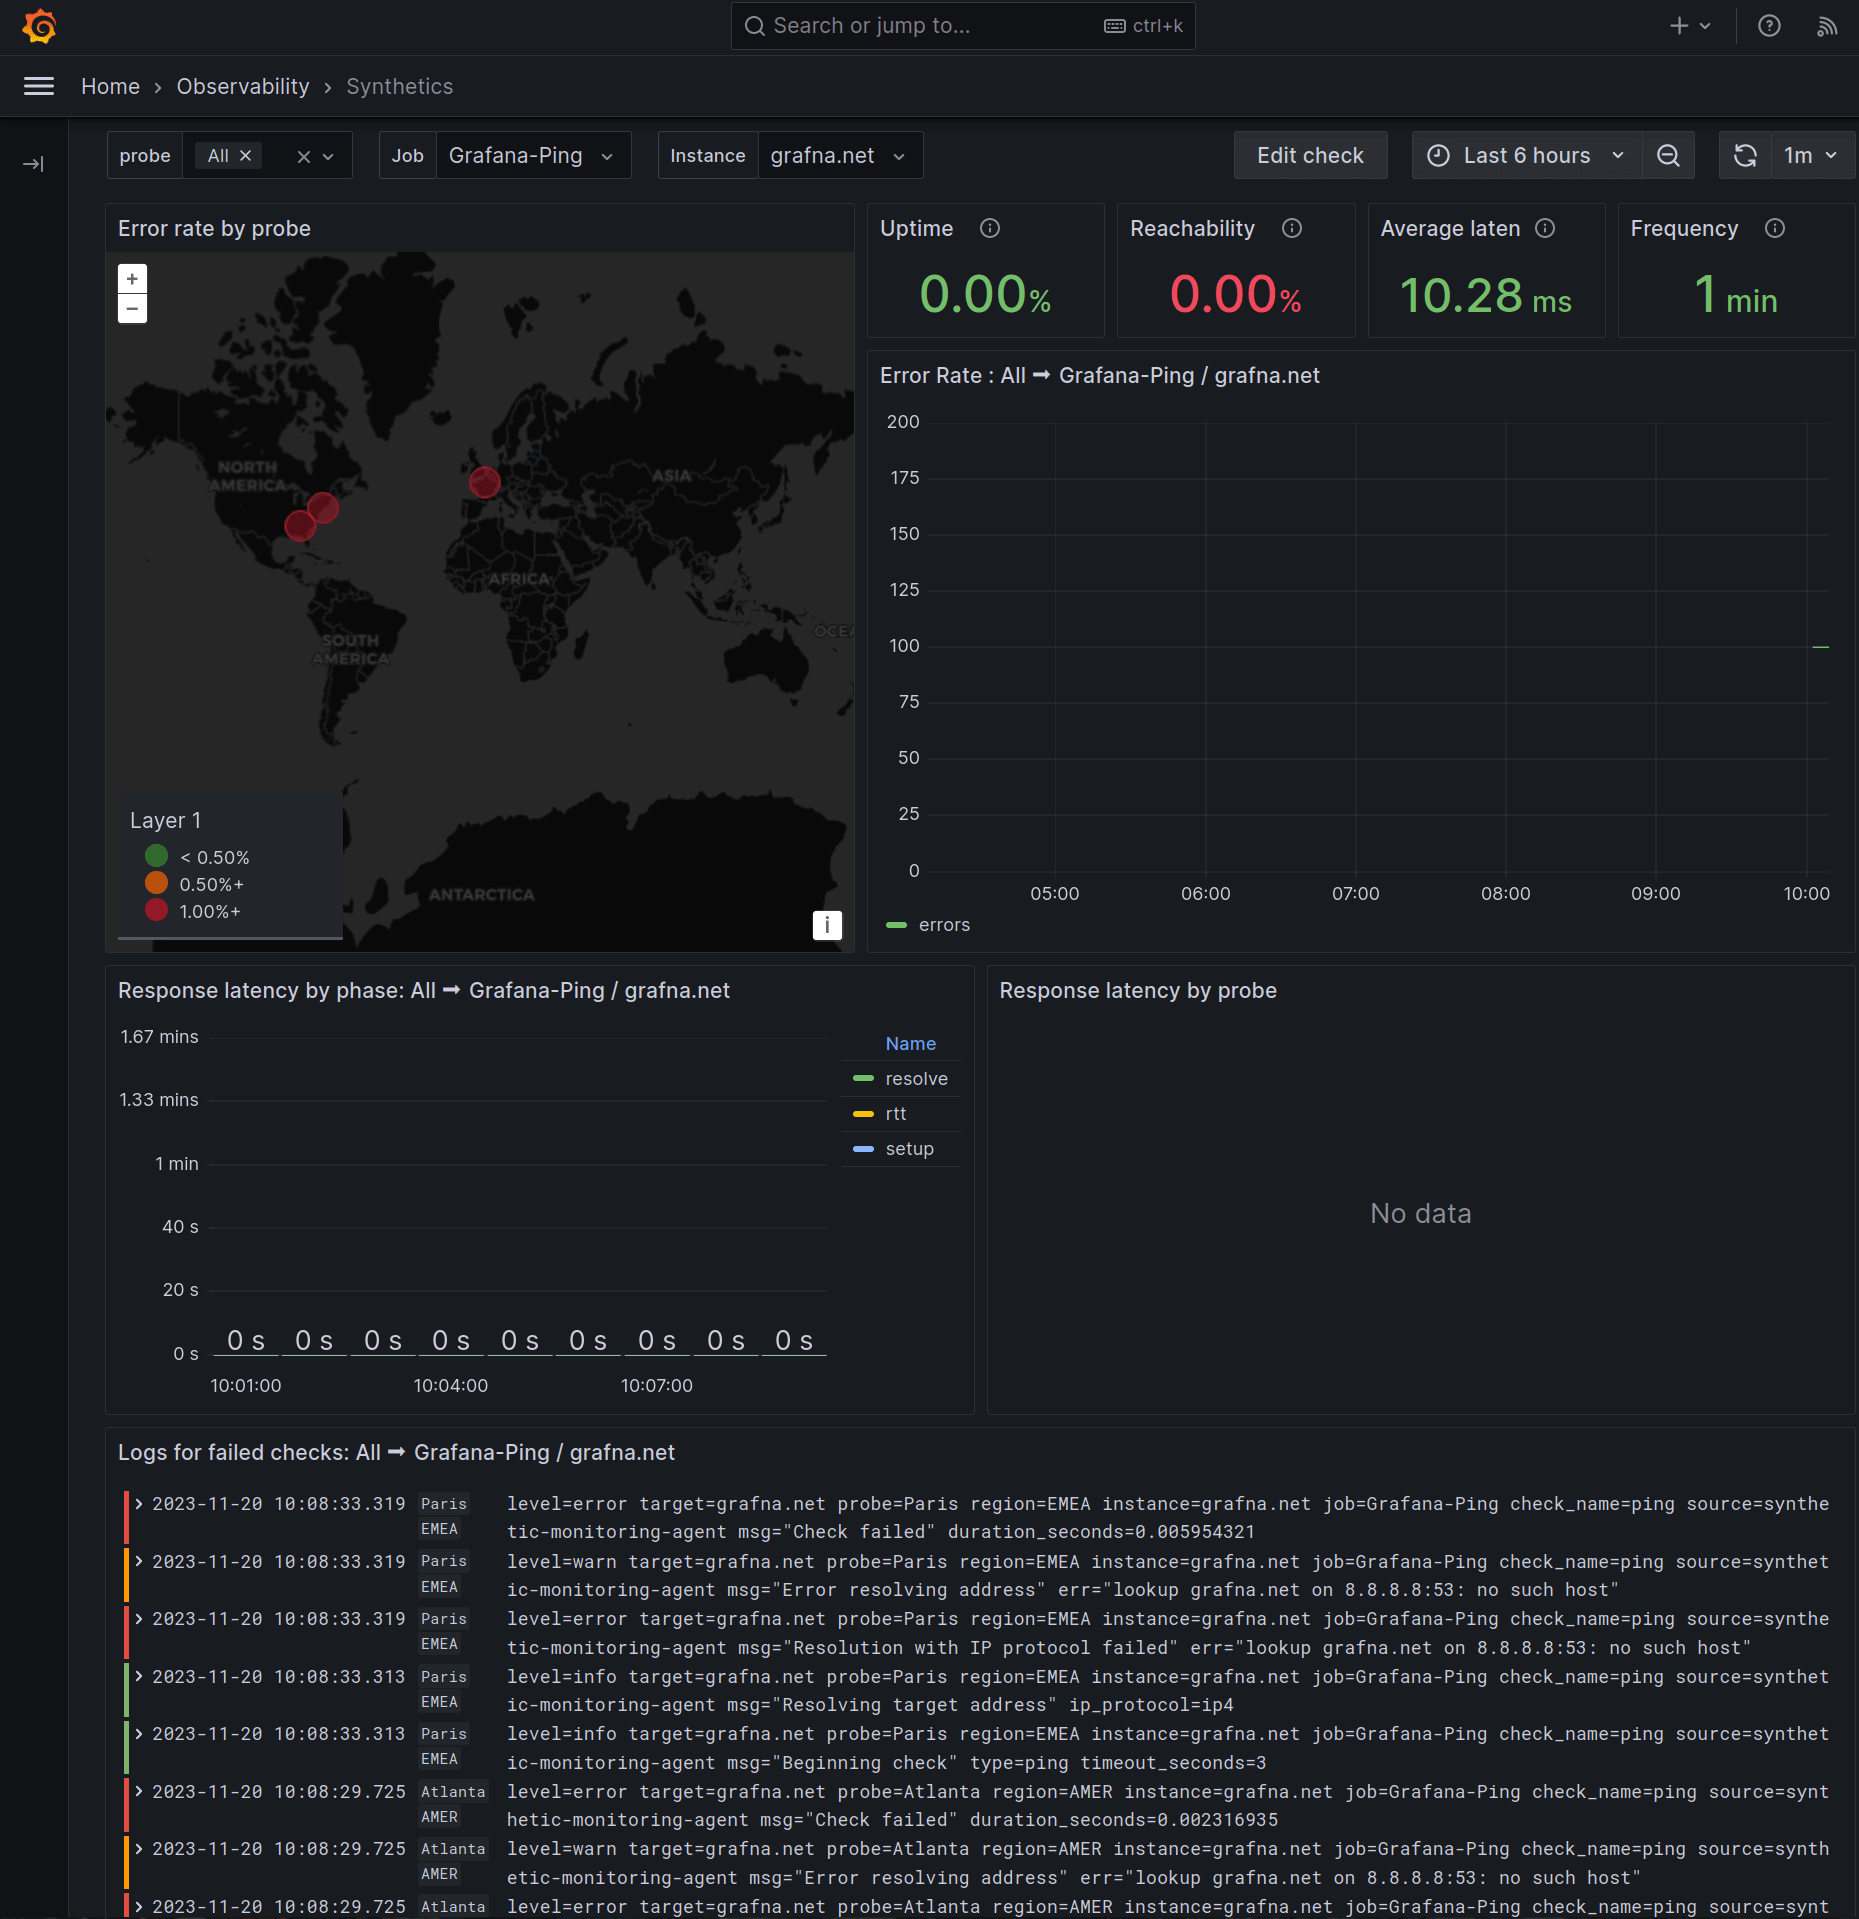
Once selected, the dashboard for our ping check will be opened, and it will look like this:

Note that the top of the dashboard has three selectable dashboard variables: probe, job, and instance. The probe variable allows you to select a single probe for more detailed information on metrics returned by it. (All is selected by default, using averages of all probes configured for the check). The job is the ping job to display information on, and as we currently only have the one job, this is set to Grafana-Ping. Finally, the instance variable allows you to find all prior instances of the target.
There are some interesting panels here, although a couple of them are empty. This is, as you may have guessed, because the check is currently failing. The Downtime panel shows the locations of the probes that we added for the check. Red shows a failed check from a probe, while green shows a successful check. There’s also a stats panel that shows the Average Latency for the check, the Frequency for it (currently 60 seconds), and the Uptime for the check target.
So why’s the check failing? Well, we actually made a typographical error when specifying the target for the grafana.net server when we configured the check. Take a look at the Error logs for .*: grafna.net panel (which includes the target typo). You’ll see a repeated set of errors that look like this:
2021-01-22 17:52:35

level=info target=grafna.net msg="Resolving target address" ip_protocol=ip4

2021-01-22 17:52:35

level=info target=grafna.net msg="Beginning check" type=ping timeout_seconds=3

2021-01-22 17:52:30

level=error target=grafna.net msg="Check failed" duration_seconds=0.000799491

2021-01-22 17:52:30

level=warn target=grafna.net msg="Error resolving address" err="lookup grafna.net on 127.0.0.1:53: no such host"

2021-01-22 17:52:30

level=error target=grafna.net msg="Resolution with IP protocol failed" err="lookup grafna.net on 127.0.0.1:53: no such host"
This shows that the grafna.net target didn’t return an ICMP echo, because it couldn’t be reached (at the time of writing, this host doesn’t exist).
Having looked at the logs and determined why the check is failing, you can now go back to the configuration page for this check to change it.
Do this by going back to the Synthetics homepage, selecting the option to view the existing checks, and then clicking the edit check option, represented with a pencil right below latency metrics. Change the Target from grafna.net to grafana.net, and then select Save at the bottom of the page.
Shortly after changing the target, go back to the dashboard page for the check. Now you’ll be able to see that the check is working correctly, and you’re getting data from all six probes.
Checks, checks, and more checks!
We’ve given you a brief overview of how to create and view a ping check with synthetic monitoring, but there are in fact six different types of checks that can be used to ensure that your web-based application is available and ready to serve your customers:
PING
- Test the availability of a host using ICMP echo packets, ensuring responses occur inside a specified timeout.
DNS
- Ensure DNS lookups are carried out within a specified timeout period. You can specify the types of records returned and the name servers to use, and allow both the response code expected and a regex to validate the returned record.
HTTP[S]
The HTTP and HTTPS checks include a wealth of configuration functionality that includes:
- REST method used in a request, as well as programmable bodies and headers and authorization options.
- Validation criteria for the response, including status codes returned, HTTP version checks, SSL options, and the ability to specify regexes for both returned body and headers.
- TLS options for specifying server and client certificates and keys.
TCP
- TCP specific checks including those for HTTP[S] but tailored for generic TCP payloads.
Traceroute
- Traces the path of a request through the Internet, giving more information about where issues might be present between the client and the server.
MultiHTTP
- MultiHTTP checks can send multiple HTTP requests to different URLs within a single check. It’s also possible to use the results of one request in a later one, and make several assertions for each request.
Additionally, synthetic monitoring allows you to create your own private probes, which bring with them the flexibility to create availability checks from any location you want to install them around the world.
REST API functionality. The ability to provision checks programmatically and store check data as Prometheus metrics and Loki logs. The option to include endpoint availability visualizations in dashboards you already have for monitoring your infrastructure. All of these things mean that synthetic monitoring significantly levels up from its worldPing heritage.
In a future post, we’ll delve into greater depth on the other types of monitoring checks available, as well as creating private probes and using the REST API.
In the meantime, just log into your Grafana Cloud account to try out synthetic monitoring for yourself. If you are not currently using Grafana Cloud, you can sign up for a free 14-day trial of the Pro plan to explore unlimited metrics, logs, and users, long-term retention, team collaboration features, and more. Afterward, you’ll automatically be moved to the new free tier, which gives you access to our composable observability platform for free with up to 10,000 active series, 50GB of logs, and 14-day retention for metrics and logs. Learn more about the free and Pro plans on our website.


