Grafana 2020 year in review
Amid a year of challenges and change, Grafana made great strides in 2020.
Grafana currently boasts more than 600,000 active installations and millions of dashboards in use across the globe. And this year, after 18,000 commits and 3,699 pull requests from 362 contributors, we revealed the next chapter of our observability story.
In May, we introduced Grafana v7.0 which expanded on the Grafana platform by making it easier and more consistent for existing users, and intuitive and simple for those not familiar with Grafana. Torkel Ödegaard, the creator of Grafana, hosted a full demo of Grafana v7.0 during our first-ever GrafanaCONline. (The session is available on demand here.)
There were then three subsequent releases over the next five months, highlighting new features along the way.
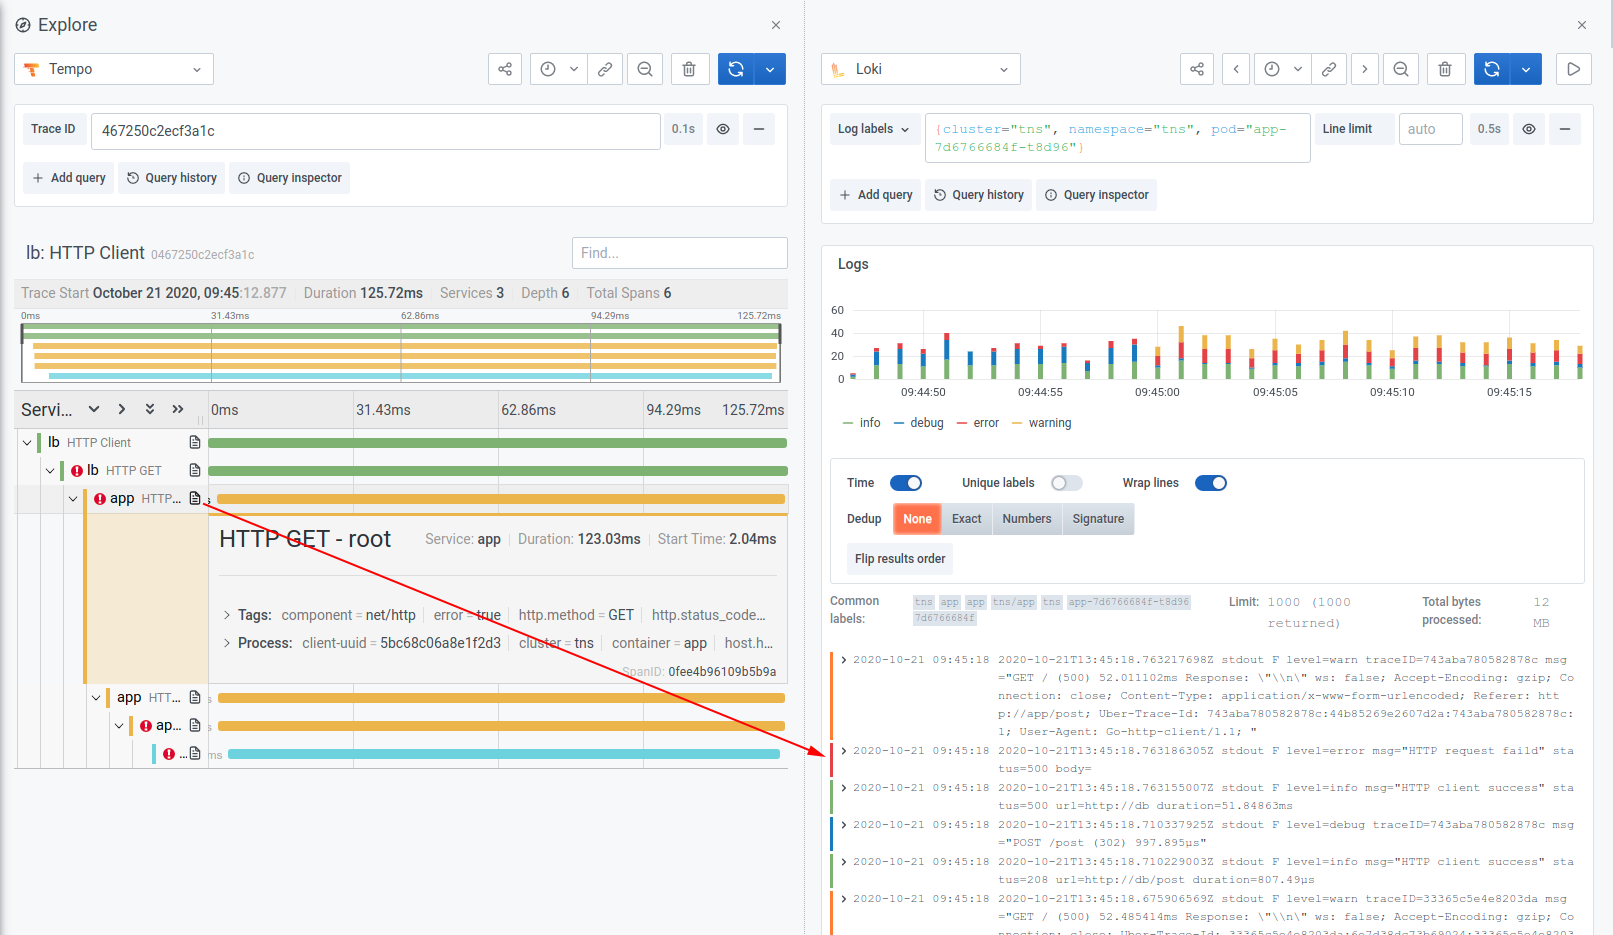
The big news in the most recent Grafana v7.3 release is around support for Grafana Tempo, our new open source distributed tracing system. This work really started with Grafana v7.0, when we rounded out our observability story by making tracing a first-class citizen in Grafana alongside metrics and logs. That release included integrations with Jaeger and Zipkin, and by October, we announced our integration with AWS X-Ray.
This fall, during our first-ever ObservabilityCON, we then proudly unveiled Grafana Tempo, an easy-to-operate, high-scale, and cost-effective distributed tracing system designed to be a robust trace id lookup store whose only dependency is object storage (GCS/S3). To check out how Grafana Tempo uses exemplars and the workflow from traces to logs, check out our ObservabilityCON session “Tracing made simple with Grafana” on demand.

Additional features introduced in Grafana v7.2 include custom date formats and new transformations such as “Group By” which allows you to group by multiple fields and add any number of aggregations for other fields. With v7.1, the team rolled out native support for InfluxDB queries plus a new feature for Prometheus that improves on the old vanilla $__interval variable where you would have to write logic yourself into the query (and that wasn’t even always possible). This new Prometheus-specific variable called $__rate_interval includes logic so that it always does the right thing, which will help Prometheus beginners without them even knowing it.
Another game-changing feature that the Grafana team introduced this year was a new plugins platform in v.7.0 so that developers can build high-quality custom plugins exponentially faster. (Check out our webinar “All about the plugins platform” on demand.) Since then there have been a number of plugins that have been added to Grafana and Grafana Enterprise to build rich context with new data sources.
Splunk Plugin: A flexible, single-pane view of the underlying metrics that measure the health of your systems, which allows you to quickly correlate and debug for reduced MTTR.
Oracle Enterprise Plugin: Leveraging the GoLang oci8 library, the Oracle plugin allows you to pull Oracle data and stats directly into Grafana dashboards. The ease of use, extensibility, and the ability to mix queries across databases in real time make this a highly powerful tool to have in your analytics and visualization toolkit.
New Relic Plugin: The most exciting change with the New Relic plugin 2.0 release is the ability to create template variables using the New Relic Query Language (NRQL).
Dynatrace Enterprise Plugin: By integrating Dynatrace with Grafana, you can easily create user-friendly, exec-ready dashboards from your Metrics API v2 data and custom metrics.
ServiceNow Enterprise Plugin: An update allows users to query any table, visualize incidents, changes, or data from any other table as annotations in your panels, and leverage ServiceNow as an alert notification channel.
Snowflake Enterprise Plugin: A Monaco-powered, type-ahead query editor that can support annotations and alerts, so you can overlay events from Snowflake on top of other charts or get alerted when Snowflake data falls outside a certain threshold.
MongoDB Enterprise Plugin: The plugin unlocks all of the data stored in MongoDB — including diagnostic metrics for monitoring MongoDB itself — for Grafana visualization, exploration, and alerting.
Hourly Heatmap Plugin: Useful if users are running a system with activity throughout the day, the panel plots the hours of the day along the Y-axis, which is currently not possible with the built-in heatmap panel in Grafana.
Github Plugin: The new plugin has allowed the Grafana team to monitor its pull requests internally.
Wavefront Enterprise Plugin: The high-scale, high query-speed metrics observability SaaS with best-in-class histogram support, best-in-class query language, and ease-of-use features for consuming distributed tracing data from Spring Boot applications.
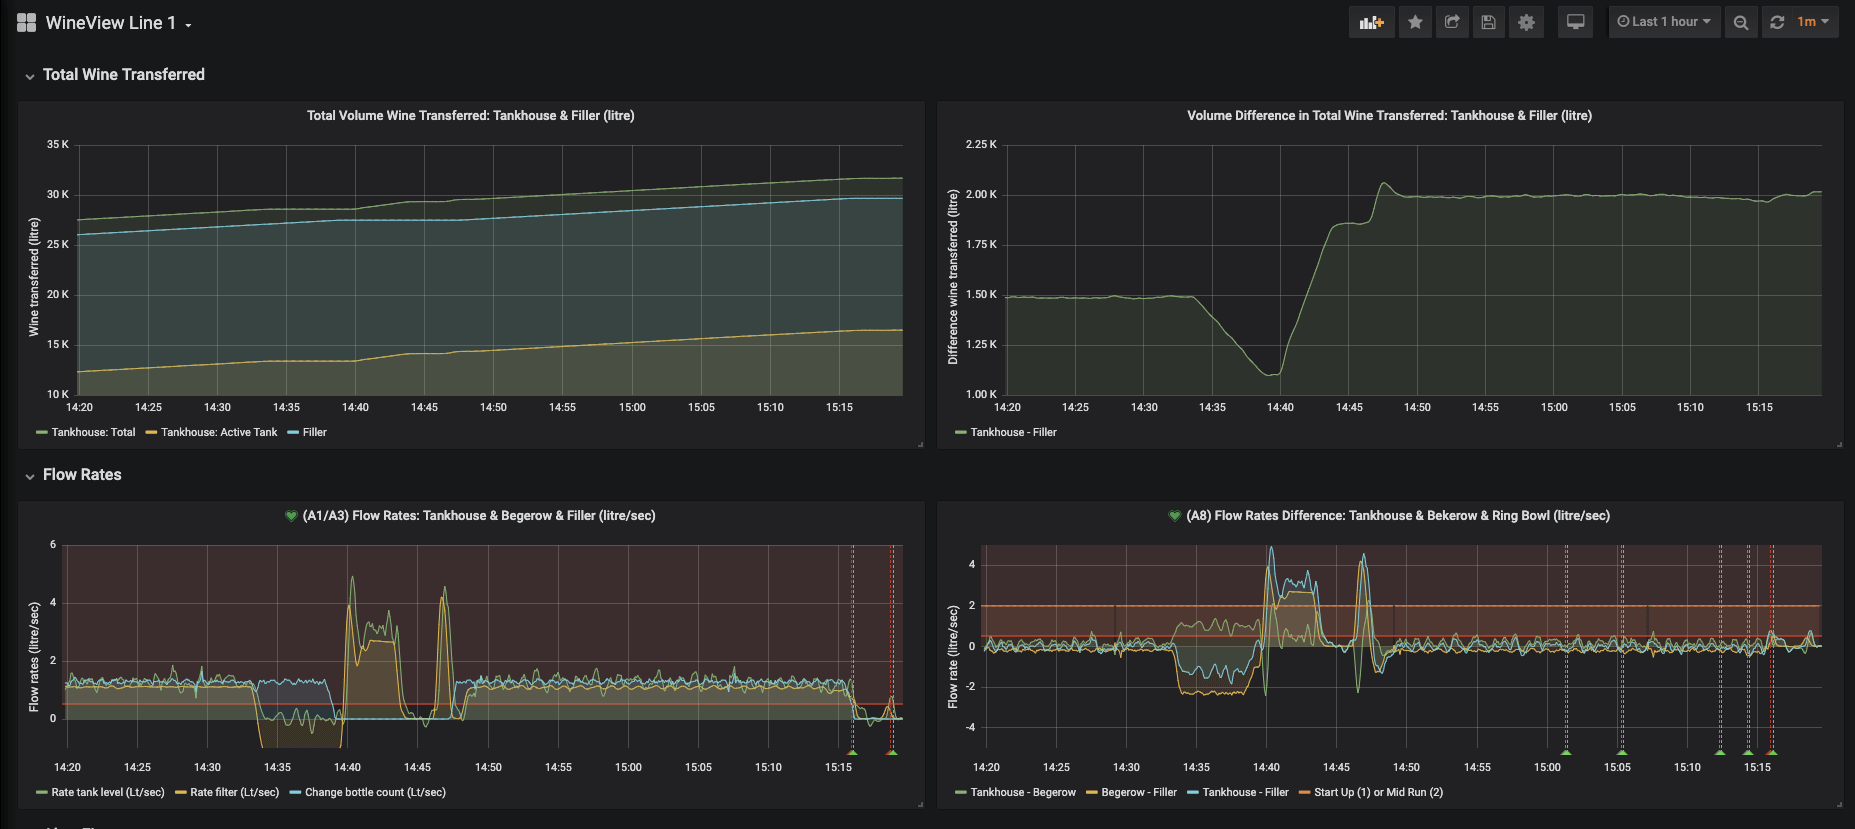
This year we also saw new and exciting ways Grafana can be leveraged across different industries. Grafana Enterprise delivered a more seamless, holistic approach to metrics at 84.51°, the data and analytics company owned by the Kroger Company. Grafana Cloud helped the DIFFERENCE Foundation visualize medical data from a mobile blood lab to monitor metabolic dysfunction, which can lead to obesity, diabetes, and many other diseases. (For a free 30-day trial of Grafana Cloud, click here.) Finally, Grafana dashboards also identified areas where Accolade Wines could minimize production waste in their bottling facilities around the world.

Whether you used Grafana to monitor a sourdough starter in quarantine (yes, that really happened) or to centralize disparate data sources into a single, user-friendly dashboard for a Fortune 500 company, we are thankful for our active community, which Grafana Labs CEO Raj Dutt calls “our superpower.” We look forward to collaborating with more contributors in 2021 and beyond!
GRAFANA RESOURCES
TALKS & WEBINARS
GrafanaCONline 2020: Grafana 7.0
GrafanaCONline 2020: Grafana plugins
GrafanaCONline 2020: Powerful graph representations in Grafana
GrafanaCONline 2020: Grafana plugins
ObservabilityCON 2020: Grafana: The open and composable observability platform
ObservabilityCON 2020: Observability with logs & Grafana
ObservabilityCON 2020: Tracing made simple with Grafana
BLOG POSTS
New in Grafana 7.2: $__rate_interval for Prometheus rate queries that just work
Grafana v7.2 released with custom date formats, new transforms and overrides
New in Grafana 7.1: Gain new data insights with InfluxDB and Flux query support
New Enterprise features in Grafana 7.0: Usage insights and user presence indicator
New in Grafana 7.0: Data transformations for all visualizations that support queries
New in Grafana 7.0: Trace viewer and integrations with Jaeger and Zipkin
Introducing the Snowflake Enterprise plugin for Grafana
New features in the ServiceNow plugin for Grafana: table query, annotations, and more!
Introducing the new and improved New Relic plugin for Grafana
Plugin showcase: The hourly heatmap panel, built on Grafana’s new plugin platform
How to pull Oracle data and stats directly into Grafana dashboards with the Oracle Enterprise plugin
Everything You Need to Know About the Splunk Plugin for Grafana
How Hiya migrated to Grafana Cloud to cut costs and gain control over its metrics
How ML6 used Grafana to deliver a 200% ROI for Accolade Wines
How SkySilk Cloud Services uses Grafana dashboards
How Grafana Enterprise Helped 84.51° Centralize Its Metrics and Tell a Holistic Story


