Trace discovery in Grafana Tempo using Prometheus exemplars, Loki 2.0 queries, and more
Grafana Tempo, the recently announced distributed tracing backend, relies on integrations with other data sources for trace discovery. Tempo’s job is to store massive numbers of traces, place them in object storage, and retrieve them by id. Logs and exemplars allow users to quickly and more powerfully jump directly to traces than ever before.
Let’s dig into some examples with a live playground to try it out!
TNS Demo
The TNS demo is a commonly used playground/example application to test and demo basic Grafana, Loki, Prometheus and Tempo features. Let’s walk through some examples using it. Follow the main readme to install prerequisites and then set up the cluster. Then navigate to http://localhost:8080, click the “Grafana” link, and let’s get started.
Loki 2.0
Example
Loki 2.0 has some amazing new query features that you really should try out. These improvements are great on their own, but they also have amazing implications for trace search with Tempo as well.
In the TNS Demo Grafana, navigate to Explore and choose Loki as your data source. Let’s start with a simple query:{job="tns/app", level="info"}. This will return a number of log lines like:
2020-11-06T15:02:10.261121224Z stdout F level=info msg="HTTP client success" status=200 url=http://db duration=1.03636ms traceID=fb0fbe73200e474
2020-11-06T15:02:10.014657751Z stdout F level=info msg="HTTP client success" status=200 url=http://db duration=2.116557ms traceID=2c963a78f1ee0c78
2020-11-06T15:02:09.98055353Z stdout F level=info msg="HTTP client success" status=200 url=http://db duration=2.24091ms traceID=7efd169fbc41ff4a
We could then click on these trace ids and jump straight to Tempo:

But what if we only wanted to see traces that failed? Or with certain latencies? This was possible in Loki 1.x, but often required tricky and brittle regex searches. Check out how easy this is in Loki 2.0:
{job="tns/app", level="info"} | logfmt | status >= 500 and status <= 599 and duration > 50ms
The logfmt pipe operator parses the formatted line and allows us to search based on the value of the fields. How cool is that! You can now log any value alongside a trace id and use it to index your traces.

Configuration
All of the above features are available in current Grafana, Loki, and Tempo builds. The only other notable piece of configuration is setting up a Loki Derived Field to create a link from the Trace ID. This can be viewed in the data source config in the example:

Exemplars
Example
Exemplars are being worked on as we speak. Grafana support is expected in 7.3.x, and Prometheus support is coming soon. Note that this example uses some custom images built off of feature branches. Expect them in master soon!
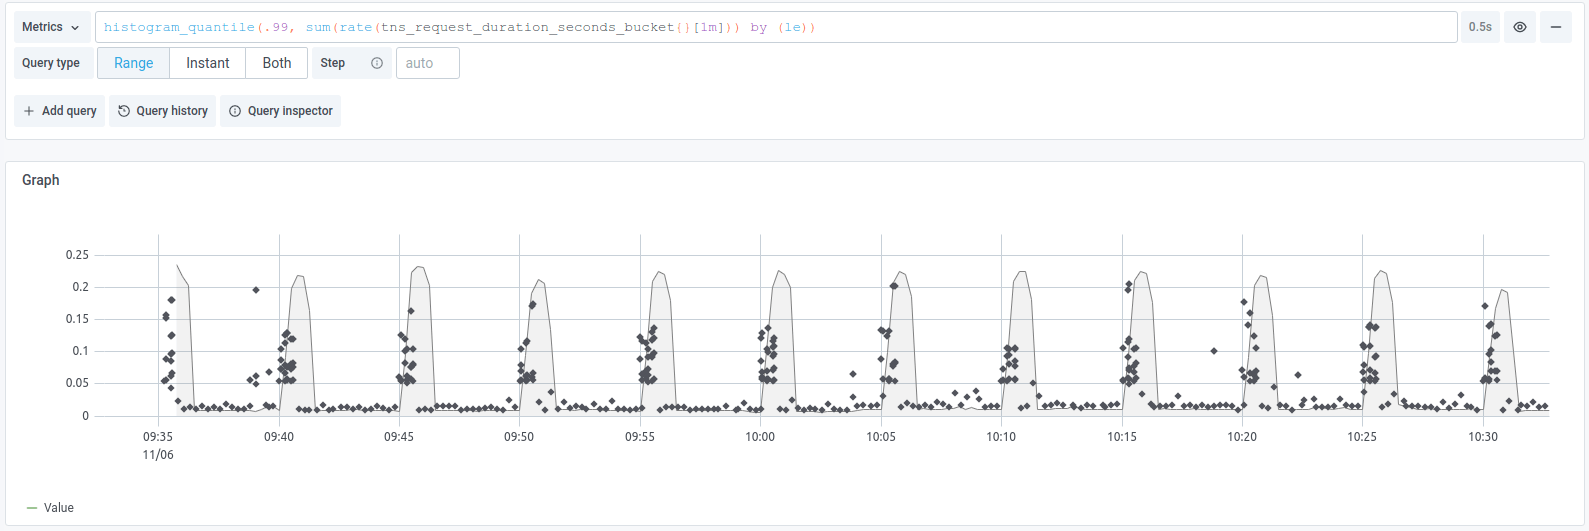
In the TNS Demo Grafana, navigate to Explore and choose the prometheus-exemplars data source. Let’s try this query:
histogram_quantile(.99, sum(rate(tns_request_duration_seconds_bucket{}[1m])) by (le))
Executing this query should show the p99 of this histogram along with some exemplars:

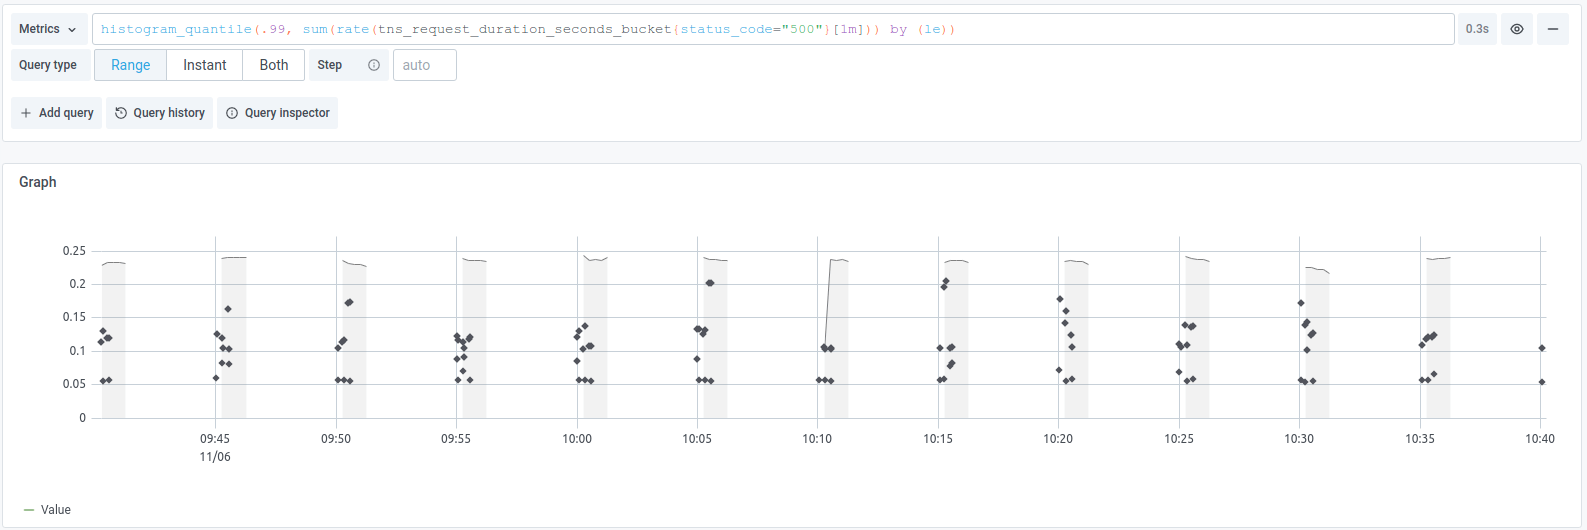
We can mouse over any dot and click it to jump straight from this metric over to a trace. If we were only interested in failing requests we could try:
histogram_quantile(.99, sum(rate(tns_request_duration_seconds_bucket{status_code="500"}[1m])) by (le))

And now every exemplar is only those requests that were aggregated to create this metric; i.e., they are all failed requests. Note that currently exemplars are enabled only for the latency histograms, so you should only see them for tns_request_duration_seconds_bucket.
Configuration
Exemplars do require some not-yet-released features. Note that the Prometheus and Grafana images are not from master. Also, the following exemplar-linking configuration exists:

Don’t fret about this too much, though! The example sets it all up for you nicely! Expect these features soon in these open source applications.
Trace discovery
Somehow, even though Tempo does not support native search, trace discovery is more powerful and easier than ever! Use logs to build a perfectly crafted index into your traces with the fields and values that work for you. Use exemplars on-the-fly to discover traces related directly to the issue you are currently triaging with just a single click.
If these ideas excite you, join us in the #tempo channel in the Grafana public slack or hop on over to the repo and let us know what you think! For a deeper dive, watch our ObservabilityCon session, “Tracing made simple with Grafana," on demand.
You can get free open-beta access to Tempo on Grafana Cloud. We have new free and paid Grafana Cloud plans to suit every use case — sign up for free now.


