Introducing the MongoDB Enterprise plugin for Grafana
This post has been updated to reflect changes in the availability of the MongoDB data source plugin for Grafana Cloud users.
MongoDB is one of the most popular NoSQL databases in the world, used by millions of developers to store application metrics from e-commerce transactions to hospital equipment inventory, from user logins to World War I diaries. MongoDB databases contain mountains of information that SREs, software engineers, and executives can visualize to run their businesses more effectively.
Grafana dashboards are most effective when they are layered with context. For example, it’s much easier to understand the impact of an increase in request latency if I can visualize my e-commerce platform’s transaction volume and duration alongside it, the software release that preceded it, and the support tickets that were opened as a result.
At Grafana Labs, we’ve been working hard to help you build rich context with new data sources like ServiceNow, GitHub, and Snowflake, and we’re excited to expand your library of available data even more. Our new MongoDB data source plugin unlocks all of the data stored in MongoDB — including diagnostic metrics for monitoring MongoDB itself — for Grafana visualization, exploration, and alerting.
Here’s a look at some of the things you can do with the MongoDB data source:
Observing and visualizing your MongoDB Data
Let’s take a look at some sample data, from a database called sample_mflix, provided by MongoDB Atlas, a cloud provider of MongoDB (you can try this out for free).
The MongoDB plugin provides an editor where you can write/paste your MongoDB queries. We have augmented the standard MongoDB query syntax to allow for one-line queries.
Instead of:
use sample_flix
db.movies.find()
You can simply do:
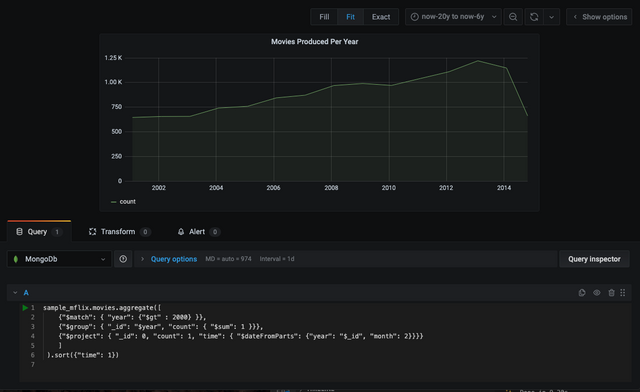
sample_mflix.movies.find()OK, let’s look at some time series data! Using the following query, we can look at movie production over the last two decades.
Sorting is typically part of the aggregate pipeline. The additional sort function here is another augmentation to get around the Atlas free tier sort limitation.
sample_mflix.movies.aggregate([
{"$match": { "year": {"$gt" : 2000} }},
{"$group": { "_id": "$year", "count": { "$sum": 1 }}},
{"$project": { "_id": 0, "count": 1, "time": { "$dateFromParts": {"year": "$_id", "month": 2}}}}
]).sort({"time": 1})
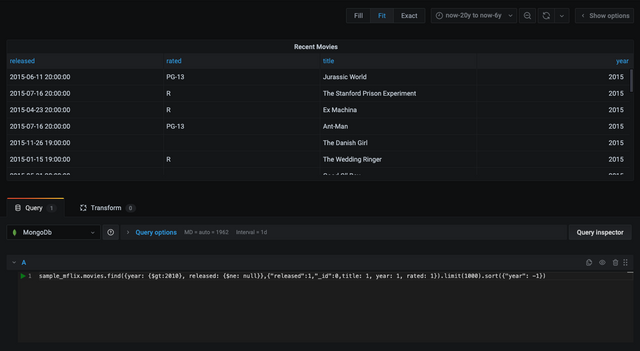
Right away you might have noticed movie production steadily increased then dropped off after 2014. Seems strange? We can do some further investigation to see what is going on here. Let’s run a query to see some more recent movies.
sample_mflix.movies.find({year: {$gt:2010}, released: {$ne: null}},{"released":1,"_id":0,title: 1, year: 1, rated: 1}).limit(1000).sort({"year": -1})
We can see that this data set does not contain any movies after 2015, so that explains it. With this plugin, we can quickly identify anomalies in data, and even add alerting so we get notifications when something strange occurs!
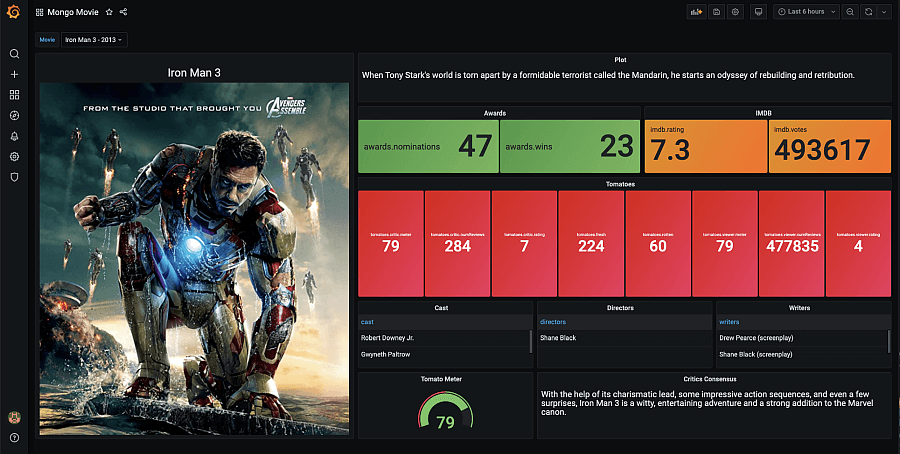
Wouldn’t it be cool to quickly see everything you ever wanted to know about a certain movie? The poster, ratings, awards, reviews, plot, writers, directors, etc.? We can do that! Below is a dashboard using standard panels provided in Grafana.

You may have noticed the dropdown for selecting the movie. The plugin supports template variables, which allow that feature. You can read more on template variables with MongoDB in our documentation.
We’ve really just scratched the surface here on how we can visualize and observe our data. The possibilities are endless. Now let’s now move on to diagnostics.
MongoDB diagnostics
Wouldn’t it be great to monitor your MongoDB so you can quickly see, at a glance, everything that is happening under the covers? And set up alerts so you know ahead of time when something might fail?
What are some things we might want to monitor?
- Server connections: available, current, and total connections
- Network: bytes in and out and number of requests
- Memory usage
- Authenticated users
- Connection pool stats: status, created, available, in use
- Database stats: collections, data size, indexes, etc.
You can capture all of that. Let’s look at a diagnostics kitchen sink dashboard, just to get an idea of the capabilities here.

We’ve thrown a lot in here. What is great about Grafana is that you can build your own dashboard to your liking.
Conclusion
With the Grafana MongoDB plugin, we’ve shown that it’s possible to quickly visualize and observe not only MongoDB data, but also diagnostic metrics. That way, you can diagnose problems and set up alerting so you know ahead of time when you need to make adjustments to not just keep MongoDB up and running, but also running efficiently.
The MongoDB Enterprise plugin is available for users with a Grafana Cloud account or with a Grafana Enterprise license. For more information and to get started, check out the MongoDB solutions page or contact our team.
If you’re not already using Grafana Cloud — the easiest way to get started with observability — sign up now for a free 14-day trial of Grafana Cloud Pro, with unlimited metrics, logs, traces, and users, long-term retention, and access to one Enterprise plugin.


