ObservabilityCON Day 4 recap: a panel discussion on observability (and its future), the benefits of Chaos Engineering, and an observability demo showcase
Over the past four days, Grafana Labs’ ObservabilityCON 2020 brought together the Grafana community for talks dedicated to observability. We hope you enjoyed all of the sessions, which are available on demand now. (Link to them from the schedule on the event page).
The conference wrapped up with predictions and advice from observability experts, lessons in failure, and Grafana Labs team members showcasing ways Grafana and other tools fit into an observability workflow.
If you missed Day 4, here’s a recap of the presentations:
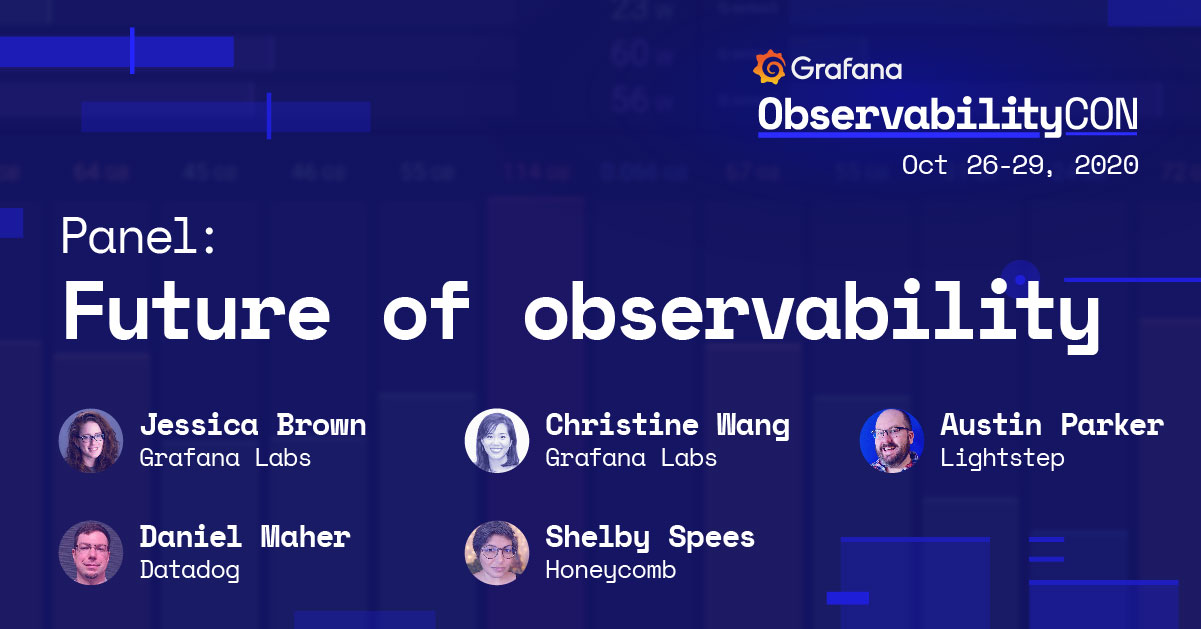
Panel: Future of observability

Grafana Labs’ Engineering Manager Jessica Brown led a panel experts—Grafana Labs’ Solutions Engineer Christine Wang, Honeycomb’s Developer Advocate Shelby Spees, Datadog’s Developer Advocate Daniel Maher, and Lightstep’s Principal Developer Advocate Austin Parker—in a observability discussion that touched on topics such as OpenTelemetry, single observability platforms, and what’s in store for the future. Some of the Q&A highlights:
What advice would you give someone who is just starting to think about their company’s observability?
They all agreed that the answer comes from looking ahead. Spees suggested asking yourself, “What’s the difference between where I’m at now, and what’s possible with alternative approaches to observability?” And they also all stressed that that observability doesn’t belong to one department or team—it should be everywhere in an organization. Wang noted that the cost of an observability stack can be easily justified “when you can attach physical dollars to the problems you’re trying to solve.” And when it came to actually getting started, the panelists had two takes: starting small vs. starting smart. But the bottom line was the quicker people can find value in observability tooling, the more they (and others) will want to use it.
Is it realistic to consolidate toward a single observability platform?
Wang said no. Most companies she sees are using open source software such as Prometheus and Cortex for 80 percent of their observability needs, and they may use a specialized commercial platform for the other 20 percent. Parker, however, thinks it’s best to avoid an “elaborate strategy” that involves using a particular commercial tool when you already have your data and you just need to pay attention to it, analyze it, and alert on it. Spees noted that Honeycomb lives in one tool 90 percent of the time, and they’re working to eliminate the other tools because they don’t even look at them.
If someone makes an open source tool and someone else wants to instrument it: What do we do? Do we need to work together to build something?
“There’s nothing I love more than seeing everybody come and work together,” said Parker, who spoke about the popularity of OpenTelemetry and how people can contribute to the community (and how corporate backing is making a lot of that possible). Maher focused on the importance of education and knowledge-sharing, which he said will help people get more excited about ideas like OpenTelemetry. When that happens, he said, “the easier it will be to then get people adopting tools, and producing software, and releasing that to the rest of the world.”
What do we think we’re going to be talking about this time next year?
Among the predictions: Spees said she’d expect to see more support for high cardinality data in both the vendor space and the open source space, and she also predicted there will be observability interns building out instrumentation for companies. Wang predicted the convergence of closed source platforms and open source projects. Parker said he’s bullish on AI and ML, and Maher said that further into the future, look for observability instrumentation to be built right into programming language.
Watch the full session on demand here.
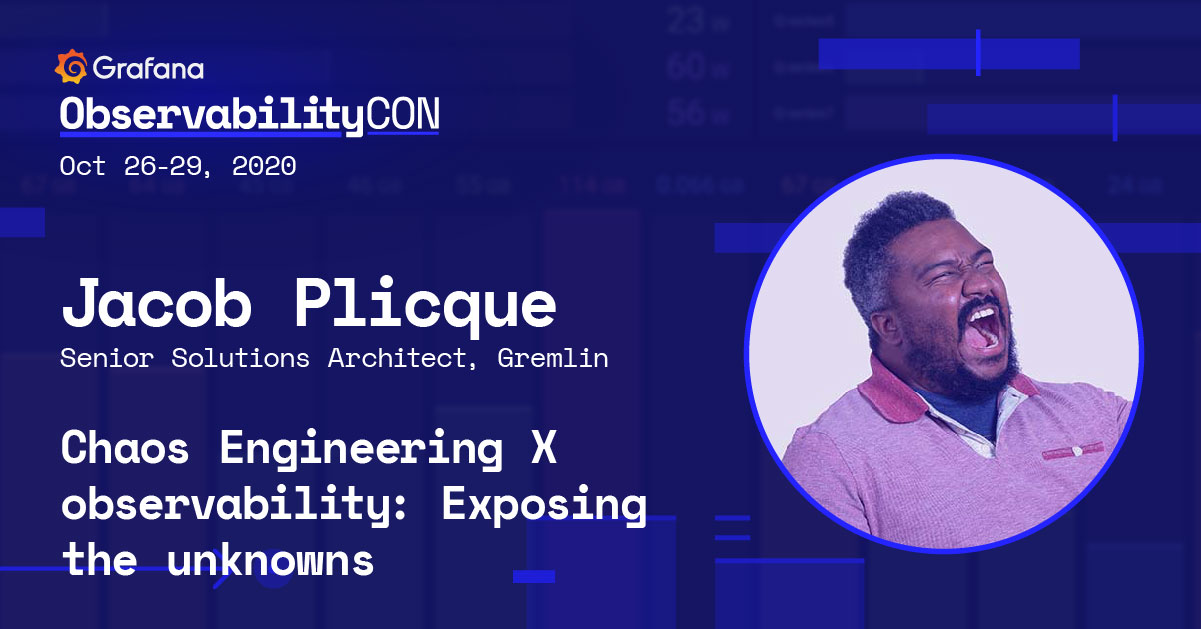
Chaos Engineering x observability: Exposing the unknowns

Jacob Plicque, Senior Solutions Architect at Gremlin, began his presentation with the classic nightmare scenario: You’re awoken by a work call in the middle of the night, and when you check your dashboards all you see is a sea of red. Only one of your two data centers is reporting, and you don’t have the access or information needed to fix the problem on your own.
That led him into his discussion of the fundamentals of Chaos Engineering, the process of injecting failure in a controlled way to build more reliable systems. (Companies like Amazon and Netflix have been doing it for years.) “The ultimate goal of Chaos Engineering,” Plicque said, “is to shine a light on the latent issues that already exist.”
Chaos Engineering has two crucial benefits: “First, we can proactively identify and fix bugs that could produce an outage, rather than waiting for a system failure to show us where the problem is,” he said. “And secondly, by running these proactive game days, our engineers grow more familiar with system behavior, which actually makes them more effective during an incident—not to mention, this also helps us to tune our monitoring and detection systems, so we’re going to detect issues earlier.”
Plicque said there’s one important thing to note about chaos experiments: You need to start small and carefully, then increase the blast radius. It also helps to adopt the practice in the development phase, so engineers can begin to architect for failure early.
He ran some demos to showcase troubleshooting scenarios, then noted the questions and next steps that should follow. Observability-wise, the focus should be on KPIs, MTTD, MTTR, latency, and errors (400s/500s).
Plicque emphasized the importance of sharing failure stories with each other. “In a lot of cases,” he said, “we’re trying to solve a lot of the same problems.”
Watch the full session on demand here.
Observability Demo Showcase

In this session, four Grafana Labs team members ran demos to showcase ways Grafana and other tools fit into an observability workflow.
Grafana Loki
Solutions Engineer Ronald McCollam kicked off things with Loki, a log aggregation and query platform built by Grafana Labs. “Logs are critical for understanding your environment from the back end infrastructure through applications, and even today, out to the edge on IoT devices,” he said. Loki is tightly aligned with the goals of the Prometheus metrics system, but Prometheus is not required to use it.
“Logging is a hard problem,” McCollam said. “Because of the sheer volume of logs, the scale of log management systems can be really difficult to deal with. And even once it’s up and running, you have the expenses of hardware, and people, and then eye-watering software management and software licensing costs to deal with. And even then, it’s still its own silo of data—it doesn’t really play particularly well with metric data.”
Loki can work at extremely large scale but still dramatically cut costs by taking a fundamentally different approach to working with log data: It doesn’t index everything. Instead, Loki allows you to define specific fields—called labels—to index. (Loki’s LogQL query language was modeled after PromQL, the querying language that is part of Prometheus.) Those labels can be used to narrow down a search space and allows you to perform a raw, unindexed query very quickly. The upshot? “You have all of the power from your metric queries, now applied to logs,” he said, “so you can often use the same or very similar queries, or even automate queries, linking from metrics into logs without the user having to write a query at all.”
He then illustrated how Loki works with a demo.
ServiceNow plugin
Senior Solutions Engineer Dave Frankel showcased the ServiceNow data source plugin, which is available to Grafana Enterprise customers. “With the latest release of the ServiceNow plugin,” he said, “you can leverage ServiceNow as an alert notification channel, thus allowing your Grafana alerts to trigger incident creation within your ServiceNow instance.” He then demonstrated how ServiceNow data can be visualized on a dashboard; highlighted various features, query types, overrides, and transformations (a new feature in Grafana 7); showed how to use ServiceNow alongside other data; and more.
Wavefront plugin
Up next: Solutions Engineer Mike Johnson gave a tour of the Wavefront plugin for Grafana, an Enterprise plugin that can manage Kubernetes clusters. (Johnson wrote about it in a recent blog post.) During the demo, he talked about leveraging the Grafana Agent (which would help save about 40 percent on your Prometheus memory footprint), building custom dashboards that can show multiple metrics platforms in the same place, and leveraging the Grafana Kubernetes mixin. He also showed two Wavefront health-specific dashboards, one that provided a data rate view, and one for an ingestion (PPS) usage breakdown.
New Relic plugin
Solutions Engineer Christine Wang walked through how to quickly get started with the New Relic plugin. New Relic is a popular observability platform that includes tools for browser, infrastructure, and application monitoring. It’s another Enterprise plugin. The plugin allows you to visualize your APM metrics within Grafana and create dashboards where you can visualize metrics, logs, and traces side-by-side from any data source, such as New Relic with Prometheus, and Datadog, and Splunk.
Watch the full session on demand here.
Thanks again for being part of ObservabilityCON 2020!


