ObservabilityCON Day 3 recap: What’s new in Loki 2.0, tracing made easy with Tempo, observability at the Financial Times, and a Minecraft NOC
Today is the last day of ObservabilityCON 2020! We hope you’ve had the chance to catch the talks so far, and will tune in live for today’s sessions. View the full schedule on the event page, and for additional information on viewing, participate in Q&As, and more, check out our quick guide to getting the most out of ObservabilityCON.
If you aren’t up-to-date on the presentations so far, here’s a recap of day three of the conference:
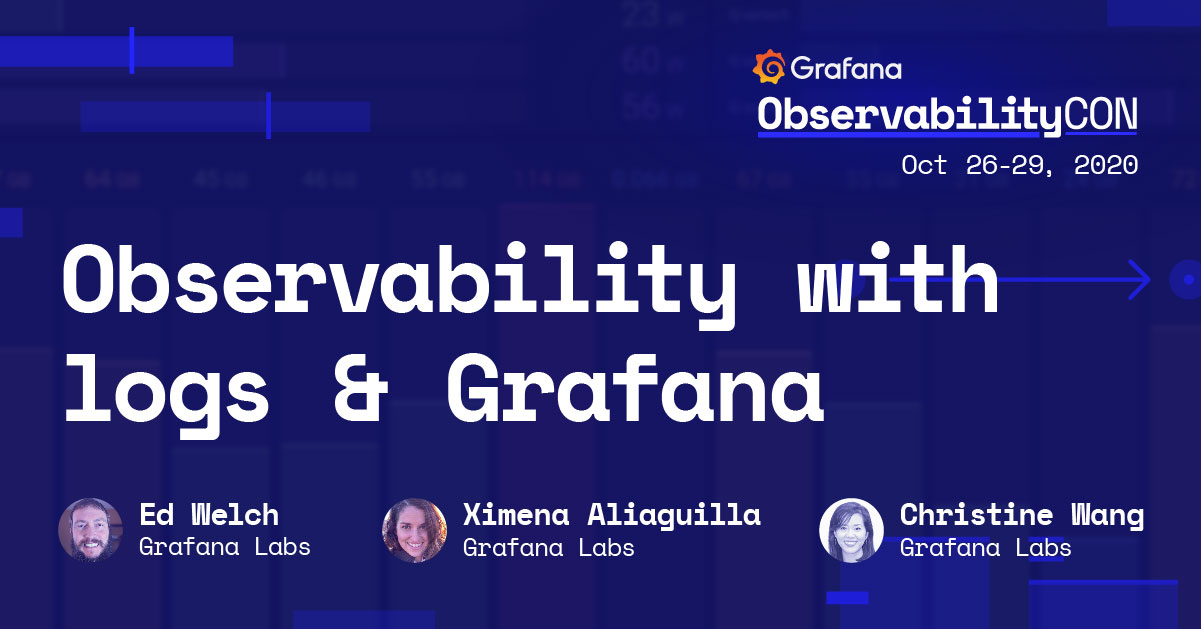
Observability with logs & Grafana

One of the big announcements this week was the release of Loki 2.0, which allows you to transform logs and normalize them for more complicated querying on top of that data, and to generate Prometheus-style alerts from any query. During this session, Loki maintainer Ed Welch offered some use cases, shared demos of some of the complex queries that are now enabled in v2.0 — and showed a dashboard generated entirely from logs. In other news: Single store Loki, introduced as boltdb-shipper in v1.5.0, is now production ready. Customer Success Engineer Ximena Aliaguilla then took a deep dive into Grafana Cloud’s new Alertmanager UI, including a demo of how to convert a LogQL query into a time series-based PromQL query in Grafana Explore, turn the new instant queries into alerts, and then import existing Alertmanager alert config into Grafana Cloud. Finally, Solutions Engineer Christine Wang showed how you can visualize logs from other data sources such as Elasticsearch, Splunk, InfluxDB, and Amazon Cloudwatch in Grafana using Enterprise plugins.
You can watch this session on demand here. (We are working on recovering the Q&A portion of this session; please check back for updates.)
Monitoring decoded: Why, what, and how?

The Financial Times may be best known for its salmon-colored print newspaper, but these days the company is a digital news media organization with a website built on microservices architecture. It’s crucial to know the health of these services at all times, and that’s where monitoring comes in, Tech Lead Nayana Shetty said in her ObservabilityCON session.
Why monitor systems and services? Third-party software, internal teams, bad actors on the internet can break systems. And as FT once found out, even sharks eating underwater cables in Vietnam can do it! Not long ago, the FT.com zone was missing from its DNS, and the data loss impacted users, journalists, and engineering teams. FT.com has over 5,000 subdomains, so “monitoring was the only way we could actually visualize the impact of this incident,” Shetty said. There are three ways in which monitoring can help, she added: 1. Proactive issue detection, 2) quick and easy incident management, 3) keeping services (and thus customers) happy.
Monitoring is in large part simply creating a checklist of predicted problems, based on your knowledge of your systems, Shetty said. Using standard templates for monitoring (USE, RED, Four Golden Signals) can be helpful. At FT, the teams use many monitoring tools for different capabilities: log aggregation (Loki, Elasticsearch, Splunk), metrics aggregation (Graphite, Cloudwatch, Prometheus), performance testing (Speedcurve), basic health checks (Pingdom and custom health check APIs), visualization (Grafana and an internal tool called Heimdall), and alerts (Slack). “Grafana gives us a detailed view of all of the different metrics for any particular service,” said Shetty, who shared a Grafana dashboard that combined the USE and RED methods to show a detailed view of how a particular service is doing.
You can check out her session on demand here.
Tracing made simple with Grafana

Distributed tracing — a way to get fine-grained information about system performance — is often described as hard, and the Grafana Labs team set out to debunk that idea in this session. First, software engineer Callum Styan explained exemplars (“a way to associate higher-cardinality data metadata — data from a specific event, such as trace id or user id — with your traditional time series data”). It’s not a brand new idea, but Grafana Labs is now using it to expand our correlation story, to enable users to jump between different data sources and different data types. For example, exemplars can be used to associate a trace id with a specific time series, to aid discoverability of relevant traces. After a demo, Styan said that exemplar support in Prometheus is close to ready (PR #6635), and Cortex support is coming too.
Software developer Annanay Agarwal then gave an overview of Grafana Tempo, our new distributed tracing backend. He described the typical debugging workflow at Grafana Labs: alert > Grafana dashboard that shows overall health > ad hoc query in Explore (error rate, latency, etc.) > log aggregation view in Loki > distributed tracing view > fix. But there were tracing limitations: loss of valuable data when sampling; cost of storage (which pushes many organizations toward sampling); operational complexity of tracing backends; limited search. So with the goal of making trace storage simple, Agarwal said, Grafana Labs created Tempo, a horizontally scalable, high-volume, multi-tenant tracing backend that is cost-effective and easy to operate. Tempo has minimal dependency, and object storage saves cost for production workloads.
Tempo has integrations with existing observability tools via Grafana’s new Tempo data source, Prometheus exemplars, and Loki’s LogQL v2. Using consistent metadata makes it easy to transition between different telemetry metrics, logs, and traces. After a demo, Agarwal pointed out that Tempo represents a change in mindset: “Not all storages need to index everything. We can log our trace ids or instrument our applications to record exemplars and store them in Prometheus. This way we don’t have to index the same metadata again and again. We can query or filter or discover traces through logs and metrics and view them in a key value store like Tempo.”
Finally, frontend engineer Zoltán Bedi talked about tracing support in Grafana via integrations with Jaeger, Zipkin, Tempo, and AWS X-Ray. His demo of the trace viewer from Grafana 7.0 showed integrations for logs to traces, traces to logs (not yet in prod), and metrics to traces.
You can watch the full session on demand here. (We are working on recovering the Q&A portion of this session; please check back for updates.) And for more about Grafana Tempo, read the announcement blog post here.
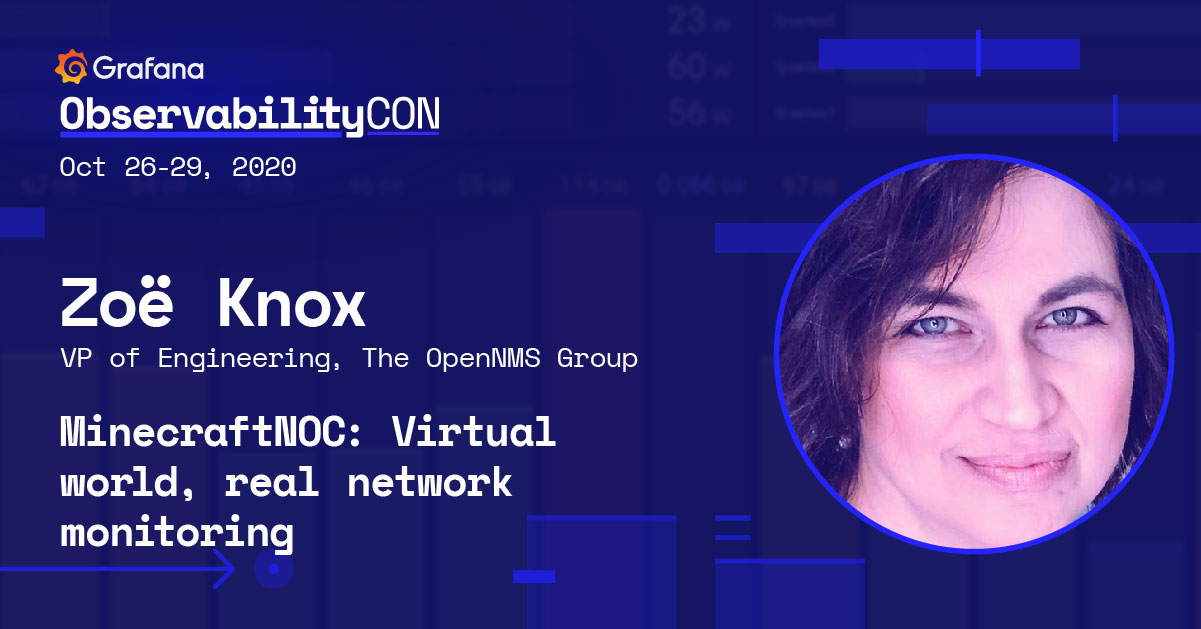
MinecraftNOC: Virtual world, real network monitoring

Closing out Day 3, Zoë Knox, VP of Engineering at The OpenNMS Group, shared what she called the “coolest and probably least practical way to observe a network”: in a Minecraft NOC! OpenNMS, an open source enterprise-grade network monitoring application platform, leverages Grafana as a key part of observability strategy. After the organization’s in-person conference had to go virtual earlier this year, the team decided to try to bring some virtual closeness to its distributed operations team with a virtual operation center in Minecraft. Using a Minecraft plugin that leverages Grafana and OpenNMS, they got live, real-world monitoring data into Minecraft and displayed the Grafana dashboards in the NOC created in their Minecraft world. Knox showed how they did it and gave a tour of the Minecraft NOC.
If you missed this fun session, be sure to watch it on demand here.
Today’s sessions
- 16:00 UTC Future of observability Find out what trends will influence the future observability in this panel discussion with experts from Grafana Labs, Honeycomb, Datadog, and Lightstep.
- 17:00 UTC Chaos Engineering X observability: Exposing the unknowns Gremlin’s Jacob Plique will show you how to use Chaos Engineering to improve your Grafana infrastructure monitoring dashboards.
- 17:40 UTC Closing session
Don’t forget that you can connect with the Grafana community and get the latest updates from the Grafana Labs team during the event on Slack. Join the Grafana Labs Community Slack workspace and drop into the #observabilitycon channel.


